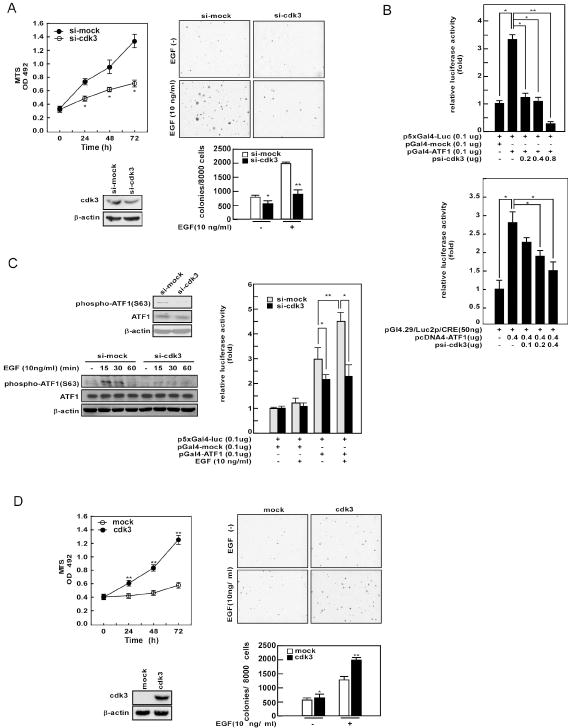
Figure 4. Knockdown of cdk3 reduces tumor growth of T98G cells in soft agar.
(A, left) The T98G-si-cdk3 cell line was generated by stable transfection of psi-cdk3 into glioblastoma T98G cells. Cell lysates (40 μg) from T98G-si-mock and T98G-si-cdk3 cell lines were used for SDS-PAGE and subjected to Western blotting using anti-cdk3 (bottom panels). The growth curves of T98G-si-mock and T98G-si-cdk3 cells were examined by MTS assay as described in “Materials and Methods”. Data are presented as the mean ± S.D. of values obtained from four experiments. Significant differences were evaluated using the Student’s t–test (*, p < 0.05; upper panel). (A, right) Anchorage-independent cell growth in soft agar was determined using T98G-si-mock and T98G-si-cdk3 cells stimulated with EGF (10 ng/ml) as described in “Materials and Methods”. Representative photomicrographs are shown (top panels) and data (bottom panel) are presented as the mean ± S.D. of values obtained from triplicate experiments. Significant differences were evaluated using the Student’s t–test and asterisks indicate a significant suppression effect on number of colonies formed in T98G-si-cdk3 cells compared to mock (*, p < 0.05; **, p < 0.001). (B) T98G cells were used to measure transactivation activity (left panel) and the transcriptional activity of ATF1 in cells transfected with a pGL4.29-luc2P/CRE luciferase reporter plasmid (containing a CRE in its promoter; right panel) in the presence of increasing amounts of psi-cdk3. (C) Phosphorylation of ATF1 at serine 63 was detected in T98G-si-mock and T98G-si-cdk3 cell lines under normal culture conditions (top left panels) or with EGF (10 ng/ml) treatment (bottom left panels). EGF-induced transactivation activity of ATF1 in T98G-si-mock and T98G-si-cdk3 cell lines was compared (right panel). At 24 h after transfection, cells were exposed to EGF (10 ng/ml) and incubated for another 12 h and then firefly luciferase activity was analyzed. Data are presented as mean ± S.D. from triplicate experiments and asterisks indicate a significant difference between si-mock and si-cdk3 cell lines (*, p < 0.05; **, p < 0.001). (D) The rescue experiments involved the introduction of a rescue cdk3 vector, which was not affected by si-cdk3, and were performed using the T98G-si-cdk3 cell line. At 24 h after transfection, the protein level of transfected rescue cdk3 was confirmed by Western blotting using anti-HA (bottom left panels), and the growth curves and anchorage-independent cell growth were examined by MTS assay (upper left panel) or colony formation in soft agar (right panels), respectively, as described in Fig. 4A.

