
Figure 5. Ectopic expression of cdk3 induces cell transformation through activation of ATF1.
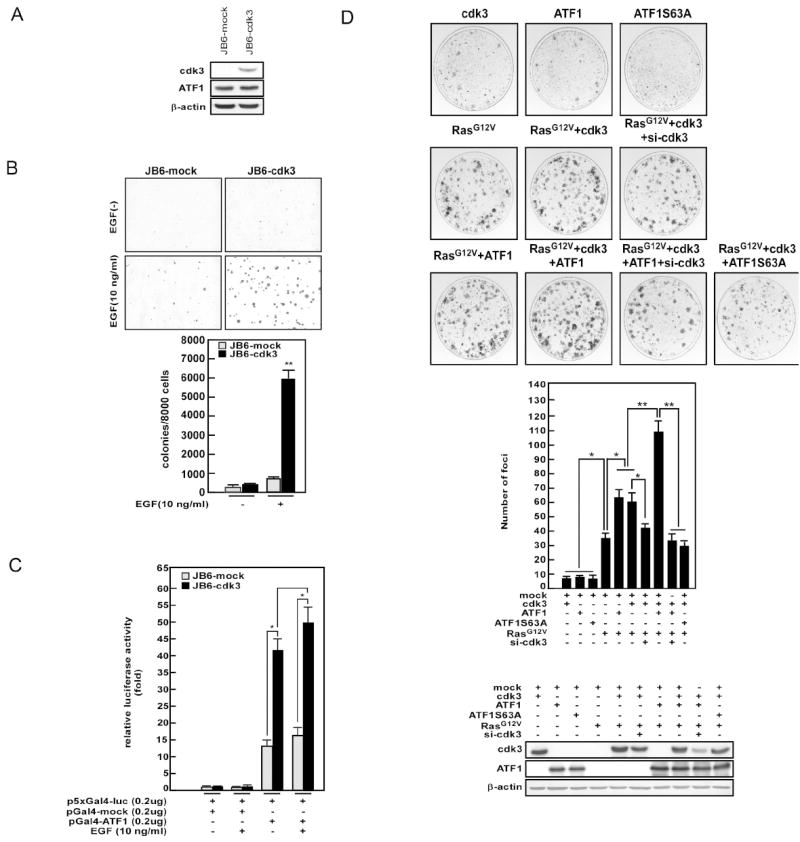
(A) The JB6-cdk3 cell line was established by stable transfection of pCMV-cdk3 into JB6 C141 cells. Proteins (60 μg) from JB6-mock and JB6-cdk3 cell lines were resolved by SDS-PAGE for Western blotting with antibodies against cdk3 or ATF1. (B) An anchorage-independent cell transformation assay was performed using JB6-cdk3 and JB6-mock cells stimulated with EGF (10 ng/ml) as described in “Materials and Methods”. Representative photomicrographs are shown (top panels). Data are presented as the mean ± S.D. of values obtained from triplicate experiments (bottom panel). Significant differences were evaluated using the Student’s t–test and the asterisks indicate a significantly higher number of colonies in cdk3-overexpressing cells compared to mock cells (**, p < 0.001). (C) EGF-induced transactivation activity of ATF1 in JB6-mock- and JB6-cdk3-transfected cell lines was examined. At 24 h after transfection, cells were exposed to EGF (10 ng/ml) in 5% FBS/MEM and firefly luciferase activity was analyzed after 12 h incubation. Data are presented as the mean ± S.D. of values obtained from triplicate experiments. Significant differences were evaluated using the Student’s t–test and the asterisk indicates a significantly increase in ATF1 transactivation in cdk3-overexpressing cells compared to mock cells (*, p < 0.05). (D) Ras-induced foci formation was examined. Various combinations of expression vectors were transfected into NIH3T3 cells as indicated and a foci formation assay was performed following standard protocols as described in “Materials and Methods”. The protein level of transfected cdk3 or ATF1 was measured with anti-HA or anti-Flag by Western blotting, respectively (bottom panels). Representative photomicrographs for each condition are shown (upper panels). Foci were counted and data are presented as mean ± S.D. of values obtained from triplicate experiments. Significant differences were evaluated using the Student’s t test and asterisks indicate a significant difference in foci formation compared to each respective control (*, p < 0.01; **, p < 0.001).