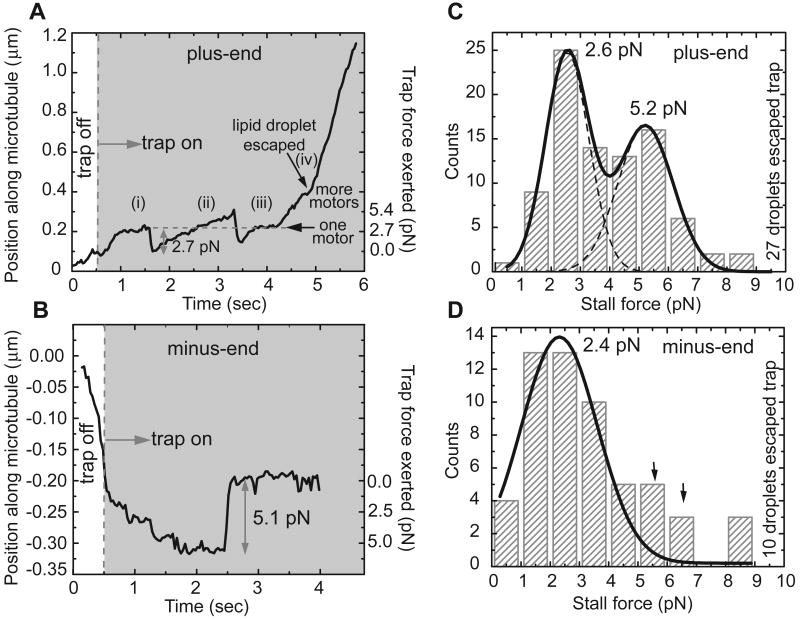
Figure 3. Quantifying droplet stall forces.
(A) Example of stalling a plus-end moving droplet. The droplet initially stalled at 2.7 pN, the motor detached, and it was pulled to the center of the trap (i). The droplet was subsequently driven out of the trap with more force, did not stall and prematurely fell back to the trap center (ii). After another stall at 2.7 pN (iii), more motors engaged and generated enough force to pull it out of the influence of the trap (iv).
(B) Example of stalling a minus-end moving droplet.
(C) Stall-force distribution for plus-end moving droplets in the wild type. The histogram is fit (solid lines) with two Gaussian distributions centered at 2.6 and 5.2 pN. These values suggest that the peaks arise from lipid droplets moved by one and two motors, respectively. The fit did not include any restrictions on peak positions. Note that a number of droplets escape from the trap (rightmost bin), indicating the simultaneous action of even more motors.
(D) Stall-force distribution for minus-end moving droplets in the wild type. The solid line is a Gaussian fit to the bins up to 4 pN. The bins above 4 pN (arrows) suggests a possible second peak (see text).

