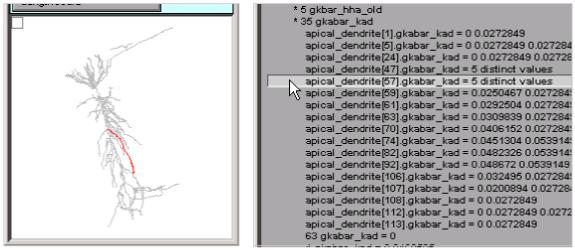
Figure 11.

Details of the distribution of inhomogeneous parameters are easily examined by clicking on individual lines in the ModelView tool. This figure shows that apical_dendrite[57] (red branch in shape plot) has 5 different values of gkabar_kad along its length.
