
Figure 5.
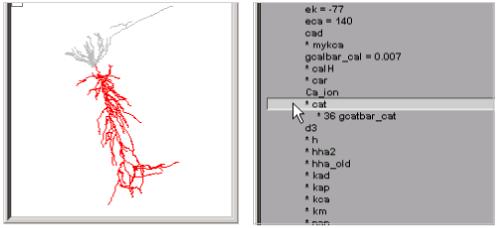
Selecting “* cat” makes the shape plot draw the sections that contain this current in red, and shows that its conductance density is nonuniform.
Official websites use .gov
A
.gov website belongs to an official
government organization in the United States.
Secure .gov websites use HTTPS
A lock (
) or https:// means you've safely
connected to the .gov website. Share sensitive
information only on official, secure websites.
Selecting “* cat” makes the shape plot draw the sections that contain this current in red, and shows that its conductance density is nonuniform.