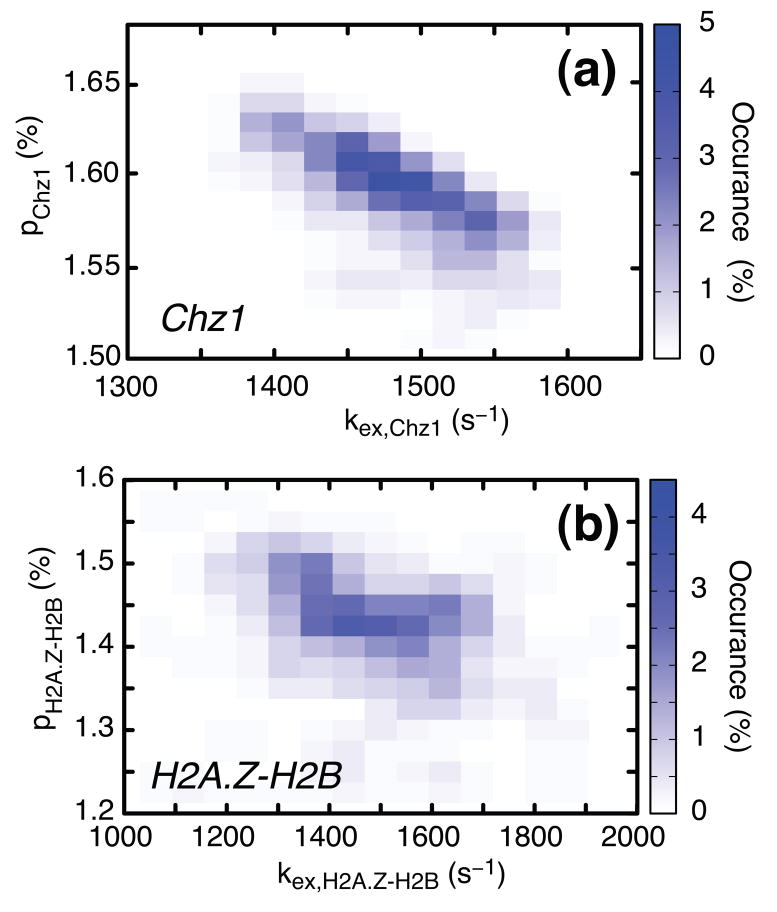
Figure 3.
Relaxation dispersion profiles derived from amide probes of Chz1 (dataset 1) and H2A.Z-H2B (dataset 2) were analyzed separately to give two sets of global exchange parameters, (kex,Chz1; pChz1) and (kex,H2A.Z-H2B; pH2A.Z-H2B), shown in (a) and (b) respectively, where kex,Chz1=koff+[H2A.Z-H2B]kon, kex,H2A.Z-H2B=koff+[Chz1]kon and pH2A.Z-H2B, pChz1 are defined in Eq. [3]. Values of exchange rates, populations and chemical shift differences between states were extracted from separate fits of dispersions in each of datasets 1 and 2 using in-house written software36 (flemming@pound.med.utoronto.ca; http://pound.med.utoronto.ca/software) by minimization of where and are experimental effective relaxation rates and their uncertainties, respectively, are model relaxation rates obtained by numerical integration of the Bloch-McConnell equations37 for a two-site chemical exchange model, ζ denotes the set of adjustable model parameters and the summation in the expression for χ2 above is over the number of experimental data points. In all fits of experimental dispersion profiles we have assumed that the intrinsic relaxation rates were the same for both exchanging states. Amide 15N and 1HN dispersion profiles recorded at both 500 and 800 MHz were analyzed together to extract exchange parameters and shift differences. After fitting all dispersion profiles, residues were excluded if the two-site model did not generate statistically significant improvements in fits over a model of no exchange at the 98% confidence level (p-level < 2%) or (ii) if the reduced χ2 value for an individual profile was greater than 3.0. Using these criteria, 22 (46) 1HN and 31 (52) 15N profiles were retained for Chz1 (H2A.Z-H2B) from the preliminary analysis and used to extract the final set of exchange rates, populations and chemical shift differences. For each of the two exchanging molecules, H2A.Z-H2B and Chz1, distributions of the kinetic exchange parameters that are consistent with the experimental data have been obtained from a bootstrap method38. In the bootstrap procedure each of the experimental observations (dispersion profiles) in the original data set is selected randomly an arbitrary number of times so that the size of the sample does not change. Here each of the n (n=52+46=98 for H2A.Z-H2B and n=31+22=53 for Chz1) relaxation dispersion profiles (15N and 1HN) are numbered from 1 to n, a set of random numbers between 1 and n generated, and the pair of experimental dispersion profiles (500 and 800 MHz) corresponding to number j selected each time j appears in the set of n random numbers. The n pairs of experimental dispersion profiles chosen in this manner are fit globally to produce values of (pb,kex) and the procedure repeated 200 times.

