
Figure 1. Formation of NT and wNT from a planar phospholipid bilayer.
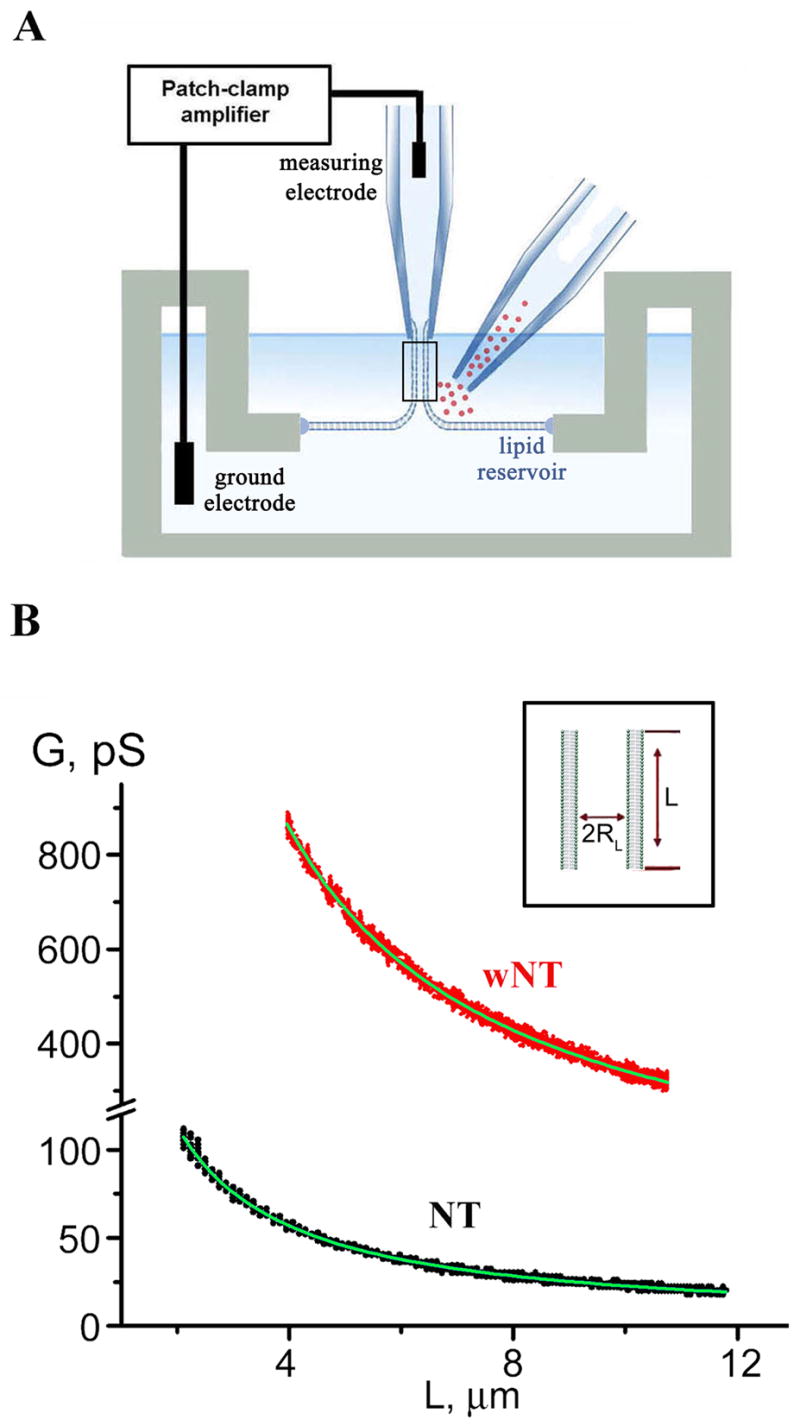
A. Illustration of a nanotube formation from planar bilayer by patch-pipette. Nanotube conductance (GNT) is determined by measuring the current resulting from application of a constant potential between measuring and ground electrodes (Frolov et al., 2003b); a pipette used to deliver chemicals directly to the nanotube is shown on the right. B. GNT measured in picosiemens (pS), depends hyperbolically on nanotube length (L); the fitting function G(L)=πRL2/(σ·(L+Loffset)) (where σ=100 Ohm·cm is the specific resistance of the ionic buffer used and Loffset is the length offset due to pipette positioning) was used to determine the luminal radius (RL) of nanotubes of different lipid composition (NT, black, and wNT, red; the fit results shown in green); insert outlines nanotube geometry.