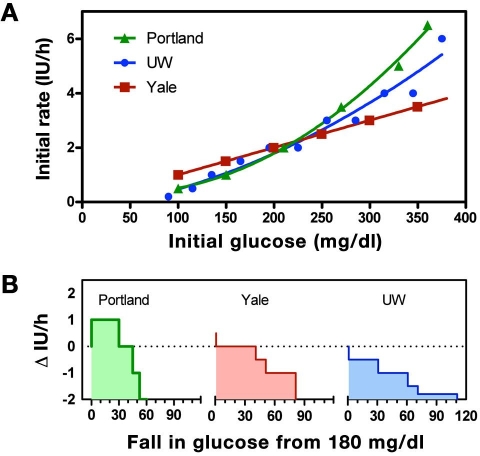
Figure 1.
(A) Insulin delivery rate (initial recommendation) for the UW (blue), P (green), and Y (red) protocols at varying initial glucose values. The P and UW protocols curve upward with increasing glucose level (solid curves show polynomial fits), whereas the Y protocol increases linearly (straight line fit). (B) Recommended change in infusion rate for each protocols, assuming that the subject begins therapy at 180 mg/dl but with a subsequent blood glucose reading the same or decreased. Dotted line corresponds to a starting rate of 2 IU/h.

