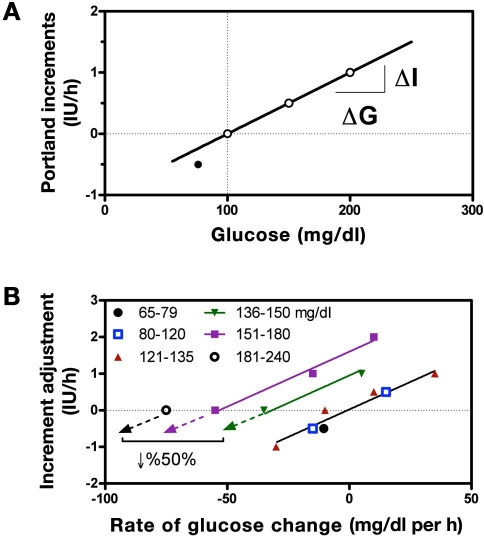
Figure 3.
(A) Incremental changes in insulin used by the P protocol in response to the prevailing glucose. For glucose above target (dashed vertical line) the change is proportional to glucose (solid line, 0.01 IU/h per mg/dl with r2 = 1) but double that when glucose is below target (solid circle, −0.5 IU/h for a drop or 25 mg/dl = 0.02 IU/h per mg/dl). (B) Adjustments in the increment based on the rate of change of glucose calculated for different glucose ranges (symbols). Within each range, the adjustment is approximately proportional to rate of change (0.03 IU/h per mg/dl per h with slope common to all lines and r2 = 0.97) but with the target rate of change (X-intercept) increasing from 0 in the glucose range of 65 and 120 to 75 mg/dl per h in the range of 181 and 240 mg/dl.

