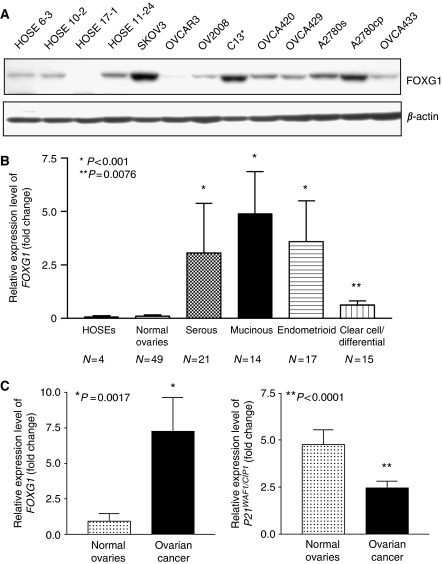
Figure 1.
FOXG1 is underexpressed and is inversely correlated with p21WAF1/CIP1 in normal ovaries and ovarian cancer tissues. (A) Western blot analysis showed the expression of FOXG1 in ovarian cancer cell lines and immortalised normal ovarian epithelial cell lines (HOSEs). (B) The relative expression levels of FOXG1 was evaluated by quantitative RT–PCR on HOSEs, normal ovaries and four histological subtypes of ovarian cancers (*P<0.001; **P=0.0076). N is the number of subtype cases. (C) Quantitative RT–PCR showed the expression level of FOXG1 and p21WAF1/CIP1 in normal ovaries and ovarian cancer tissues. The values were obtained by mean±s.e.m. (*P=0.001; **P<0.0001).

