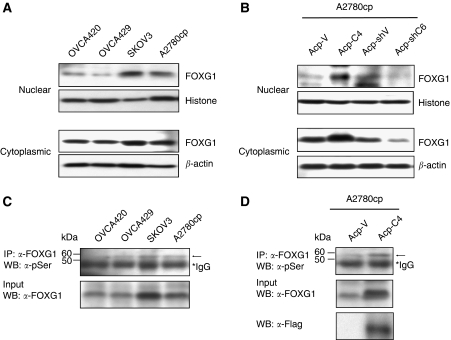
Figure 7.
Subcellular localisation and phosphorylation of FOXG1. Western blot analysis showed the expression levels of cytoplasmic and nuclear FOXG1 in ovarian cancer cell lines (OVCA420, OVCA429, SKOV3 and A2780cp) (A), and the expression of Flag-tagged FOXG1 and FOXG1 in Flag-tagged FOXG1 stable clone (Acp-C4) and FOXG1 knockdown clone (Acp-shC6) of A2780cp (B). Histone H1 and β-actin were used as internal controls of nuclear and cytoplasmic extracts, respectively. (C) Western blot analysis showed higher expression levels of phosphoserine FOXG1 (arrow) in SKOV3 and A2780cp cell lines. (D) An increased phosphoserine FOXG1 was detected in Flag-tagged FOXG1 stable clone (Acp-C4) as compared with vector control (Acp-C4) of A2780cp.

