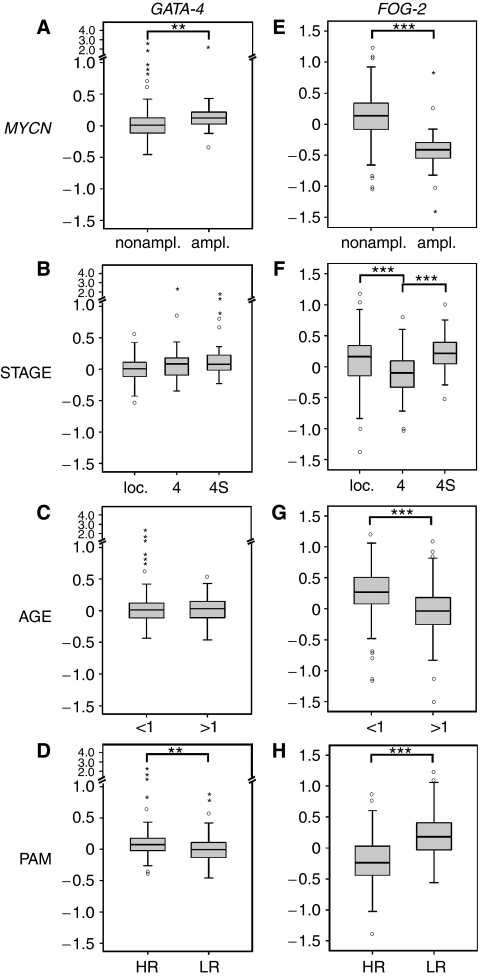
Figure 4.
Relative expression levels of GATA-4 and friend-of-GATA (FOG)-2 according to microarray analyses. (A–D) GATA-4 and (E–H) FOG-2. (A and E) MYCN-nonamplified (n=218) vs MYCN-amplified (n=32 for GATA-4; n=33 for FOG-2). (B and F) Localised stages (n=153) vs stage 4 (n=67) vs stage 4S (n=31). (C and G) Patients below 1 year (n=94) vs above 1 year (n=157). (D and H) High-risk (HR; n=82) vs low-risk (LR; n=169) tumours according to the PAM classification. Expression values are given in log ratios (sample vs reference RNA). Boxes: median expression values (horizontal line) and twenty-fifth and seventy-fifth percentiles; whiskers: distances from the end of the box to the largest and smallest observed values that are <1.5 box lengths from either end of the box; open circles: outlying values; asterisks: extreme values. **P<0.01; ***P<0.001 according to the nonparametric Mann–Whitney test.

