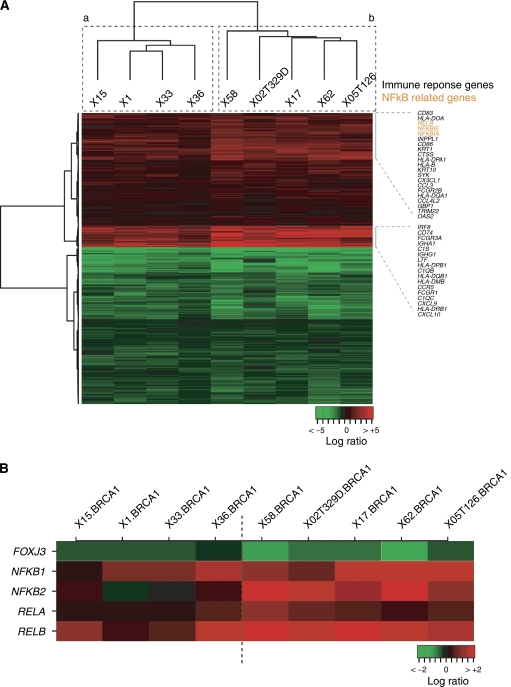
Figure 3.
(A) Unsupervised hierarchical clustering of the nine ESR1-negative BRCA1 tumours using the gene-set #2. Two subgroup/class/clusters, a (left branch) and b (right branch), are observed, showing differences in the magnitude of expression of genes related to the immune response. (B) Unsupervised hierarchical clustering of the nine ESR1-negative BRCA1 tumours using transcription factor genes of the REL/NFκB family. The same subgroup/class/clusters (a and b) as those found using gene-set #2 are observed.

