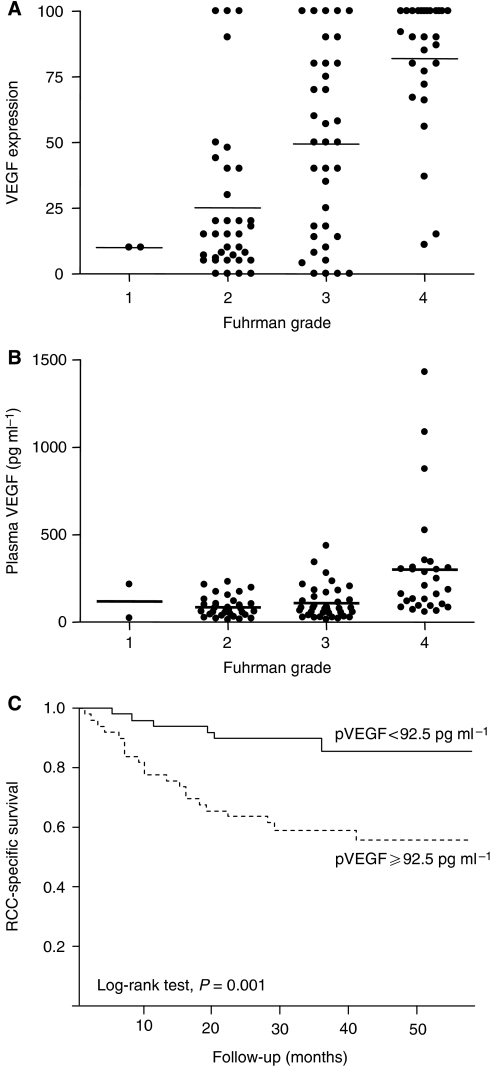
Figure 4.
VEGF expression in CCRCC. (A) Percentage of tumour tissue with positive VEGF expression according to Fuhrman grade. Horizontal lines represent mean values. (B) Concentration of VEGF in the plasma of CCRCC patients according to Fuhrman grade. Horizontal lines represent mean values. (C) Cause-specific survival curve for patients based on VEGF expression in plasma (solid line, patients with plasma VEGF<92.5 pg ml−1, n=56, 50%; broken line, patients with plasma VEGF ⩾92.5 pg ml−1, n=56, 50%).

