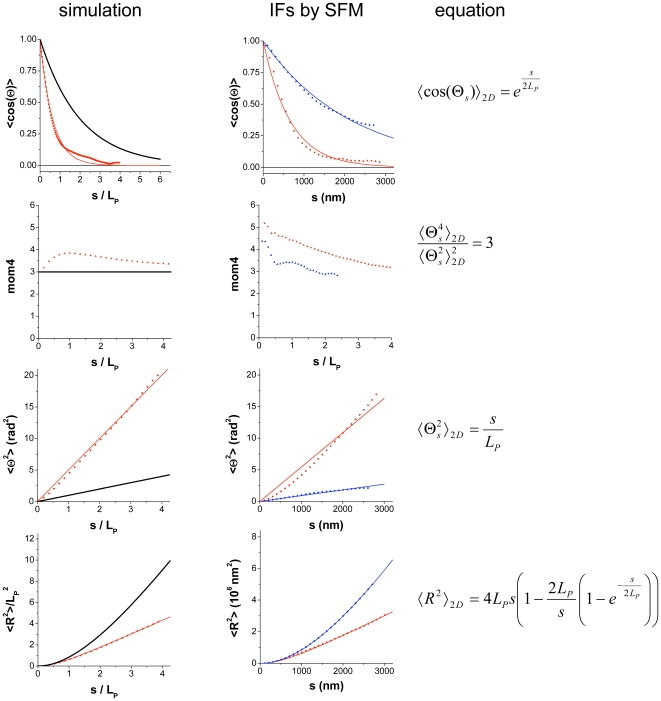
Figure 3. Quantitative analysis of the simulated and the traced contours from AFM images.
Data points are calculated from the contours (black, simulated SE; red, simulated ST; blue, vimentin on glass; red vimentin on mica). Each data set was then fitted by the equations on the right column (straight lines). The fitting results are further described in Tab. 1.

