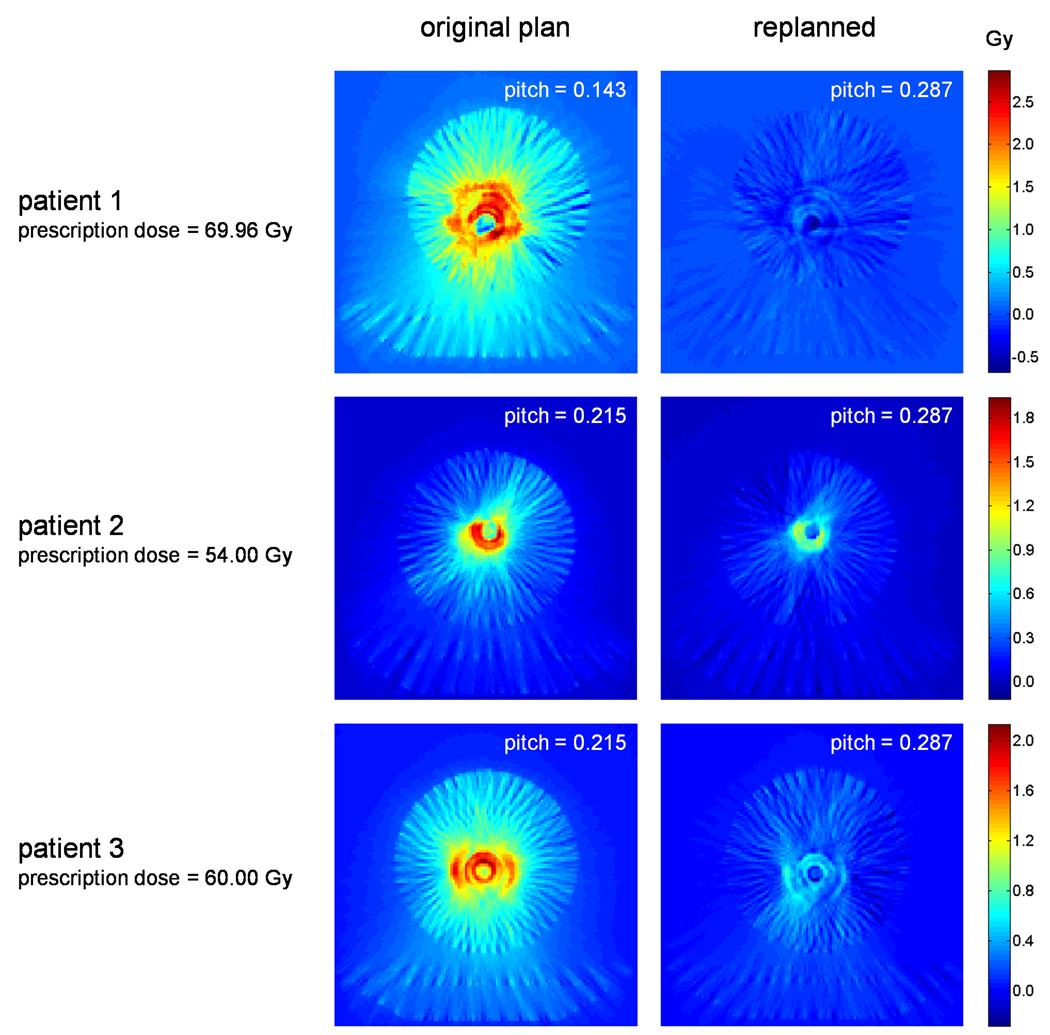
Figure 3.
Absolute dose difference maps taken between planned and reconstructed dose distributions for three patients both before and after replanning. Broad regions of high dose discrepancy are seen for original plans having mean leaf open times of approximately 60–100 ms. Discrepancies are considerably reduced for replans having increased mean leaf open times.

