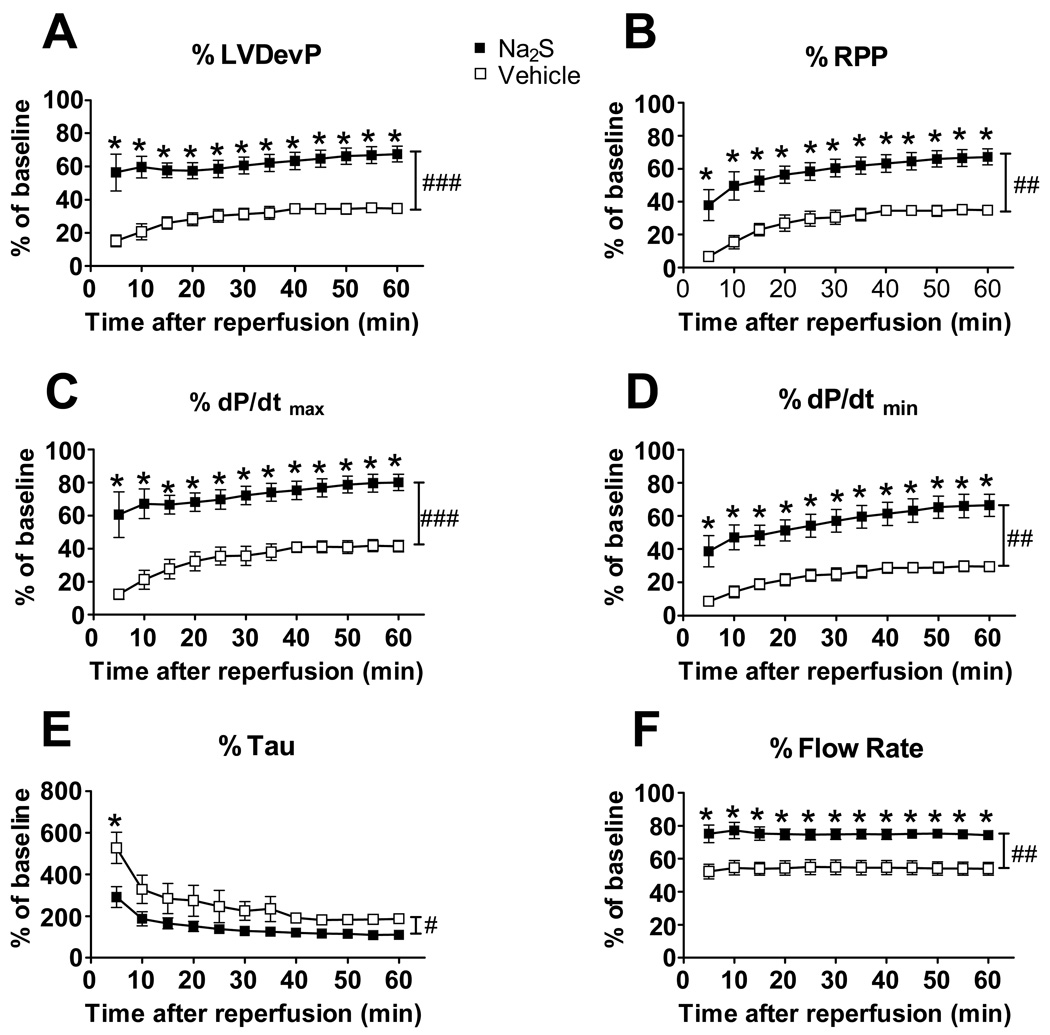
Figure 3.
Effects of Na2S in global ischemia-reperfusion in isolated-perfused mouse hearts. Percentage of baseline values are shown for maximal LV developed pressure (Panel A. LVDevP), rate pressure product (Panel B. RPP), maximal rate of LV pressure rise (Panel C. dP/dtmax), maximal rate of LV pressure reduction (Panel D. dP/dtmin), the time constant of isovolumic LV relaxation (Panel E. Tau), and coronary flow rate (Panel F. Flow Rate). ###P<0.001, ##P<0.01, and #P<0.05 for comparisons of vehicle vs Na2S, as calculated by repeated measures two-way ANOVA. *P<0.01 vs vehicle of the same time point, as calculated by Bonferroni post-tests.

