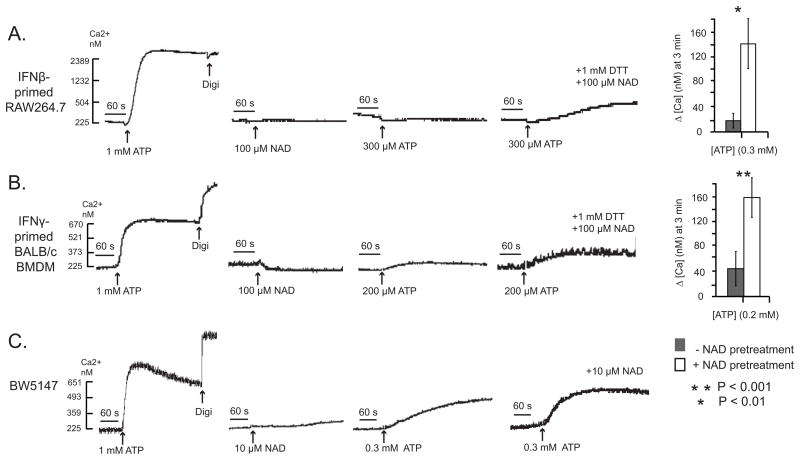
Figure 8. Comparative effects of NAD on potentiation of ATP-induced P2X7R activation in primary macrophages, a macrophage cell line, and a T-cell line.
Experiments similar to those described in Figure 6 with Bac1.2F5 macrophages were performed using other murine leukocytes that express P2X7R. A) RAW264.7 macrophages were transferred to M-CSF-free medium and stimulated with IFN-β (100 U/ml) for 24 hr. The primed macrophages were stimulated with 1 mM ATP alone, 100 μM NAD (plus DTT) alone, or with 300 μM ATP in the absence or presence of a pretreatment with 100 μM NAD (plus DTT) for 5 min. The accompanying histograms (mean±SE from 3 experiments) show the quantified changes in Ca2+ at 3 min after addition of 300 μM ATP with and without NAD pretreatment. B) BALB/c BMDM were transferred to M-CSF-free medium and stimulated with IFN-γ (100 U/ml) for 24 h. The cells were stimulated and assayed as described in (A) but 200 μM ATP as the test pulse. The accompanying histograms (mean±SE from 3 experiments) show the quantified changes in Ca2+ at 3 min after addition of 200 μM ATP with and without NAD pretreatment. C) BW5147 T lymphocytes were stimulated with 1 mM ATP alone, 10 μM NAD alone, or with 300μM ATP in the absence or presence of a pretreatment with 10 μM NAD for 5 min. These results are representative of observations from 3 experiments.

