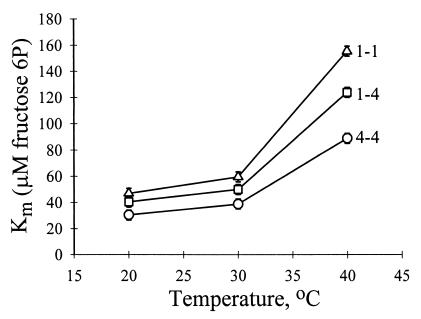
Figure 2.
Differences among phosphoglucose isomerase (PGI) genotypes in effects of temperature on the Michaelis-Menten constant (Km) of F6P. Km data are least-squares means (±SE) of two samples of 10 individuals per genotype. See Table 2 for statistical analysis.

