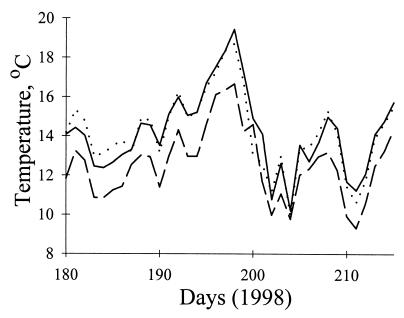
Figure 3.
Differences in ambient air temperature, Ta, between Big Pine Creek, Bishop Creek, and Rock Creek in the summer of 1998. Data are least-squares means of values obtained from dataloggers attached to willows at five localities (2,800–3,300 m) per drainage. RC (dashed line) is cooler than BC (dotted line) or BPC (solid line). See Table 3 for statistical analysis.

