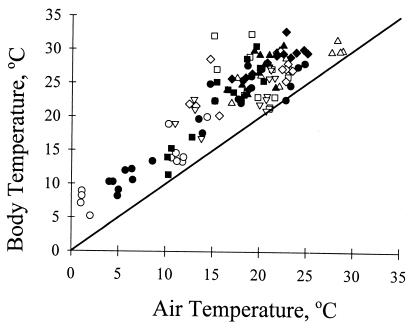
Figure 4.
Relationship between Ta and body temperature, Tb, for beetles from BPC and BC in July 1998. Each data point shows Ta and Tb for each individual in BPC (filled symbols) and BC (open symbols) at five time periods during the day: 0600–0830 (circles); 0930–1030 (squares); 1130–1300 (triangles); 1400–1530 (diamonds), and 1600–1730 (inverted triangles). See Table 4 and text for statistical analysis.

