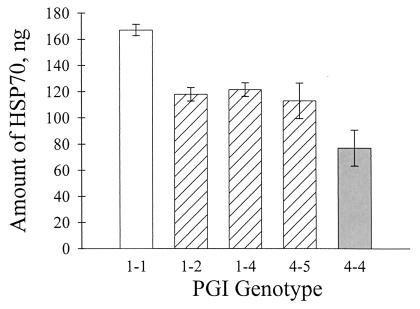
Figure 6.
Correlation between PGI genotype and Hsp70 expression for RC beetles. Data shown are least-squares means (±SE) of each PGI genotype (1–1, n = 10; 1–2, n = 7; 1–4, n = 7; 4–5, n = 1; 4–4, n = 1). See Table 5 and text for statistical analysis.

