
Figure 4.
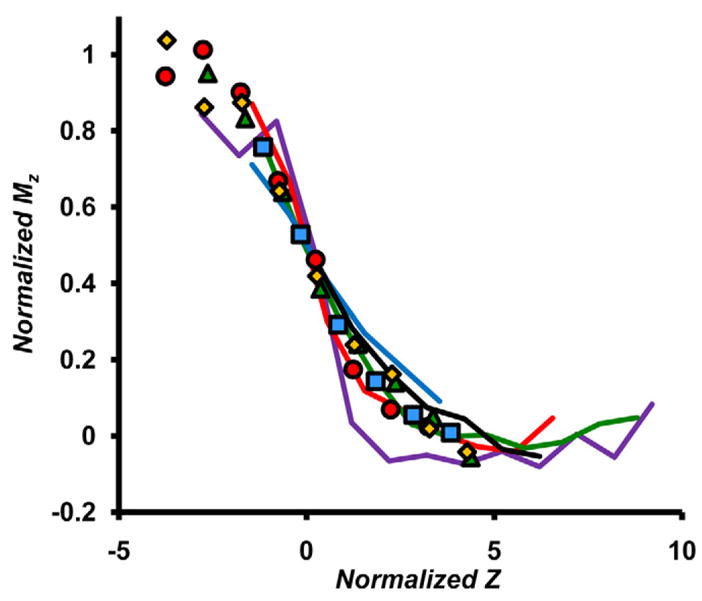
Plots of Normalized Mz vs. Centered Z for a variety of complexes analyzed under various conditions. Data from the prototypical SsDps-L spectrum (Figure 2c) is plotted as red circles, data from a spectrum of the Urease complex which has been previously reported [22, 25] is plotted as blue squares and data from another previously reported spectrum of the ά6-glutamate synthase complex [24] is plotted as yellow diamonds. Data from a native electrospray spectrum of IgG is shown as green triangles. Data from LiDps and SsDps-L spectra are plotted as solid lines. LiDps in ammonium acetate pH 6.8 (blue), ammonium acetate pH 8.7 (purple), ammonium bicarbonate pH 8.2 (green), triethylammonium acetate pH 6.8 (red), SsDps-L in ammonium acetate pH 8.2 (black).