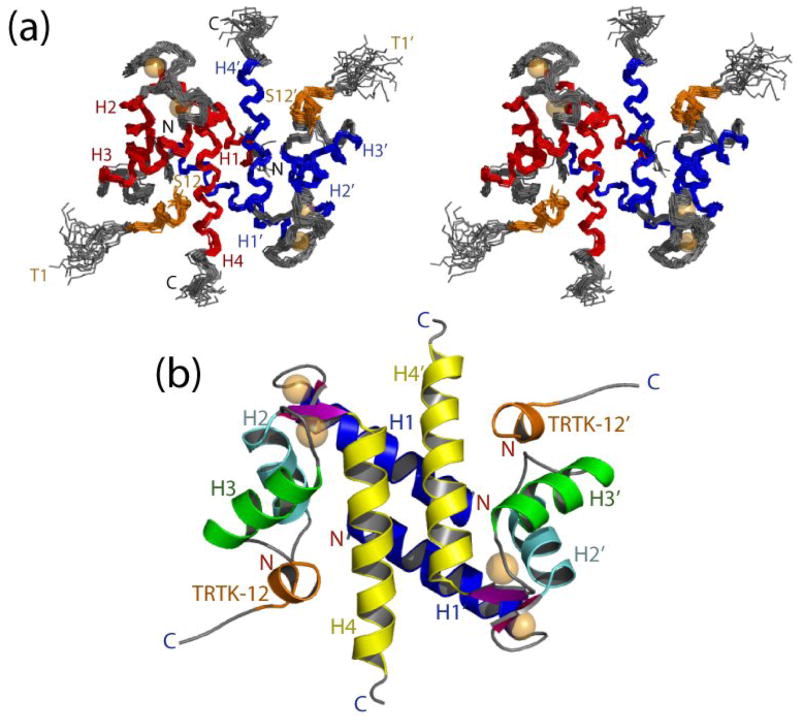
Figure 2.
The three-dimensional structure of the S100A1-TRTK12 complex. (a) Stereoview of the 20 lowest-energy structures with the RMSD for backbone atoms found to be 0.672 (residues 3–87 of S100A1 and residues 4–12 of TRTK12). The two subunits are colored red and blue for S100A1, respectively, and the TRTK12 peptide is colored orange. (b) Ribbon diagram illustrating the fold of the S100A1-TRTK12 complex.

