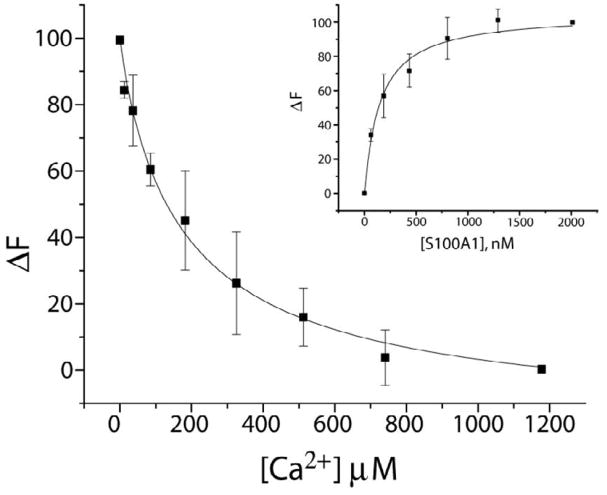
Figure 4.
Ca2+ and Tb3+ binding to S100A1-TRTK12 as monitored via Tb3+ luminescence. Displacement of Tb3+ by Ca2+ from a Tb3+-S100A1-TRTK12 complex as monitored by the decrease in Tb3+ luminescence. The sample conditions included 50μM TRTK12, 20 mM HEPES buffer, pH 7.0, and 20 mM DTT at 25 °C in D2O. The CaKD calculated from this competition experiment (CaKD=8 ± 3 μM) relied on the dissociation of Tb3+ from the Tb3+-S100A1-TRTK12 complex in the same buffer (TbKD = 149 ± 3 nM; inset). In this titration (inset), S100A1 was titrated into a solution where [Tb3+] was kept constant (3 μM) and [TRTK12] was kept at a concentration (50μM) where Tb3+-S100A1 is fully saturated with TRTK12 peptide at all points in the titration.

