
Figure 1.
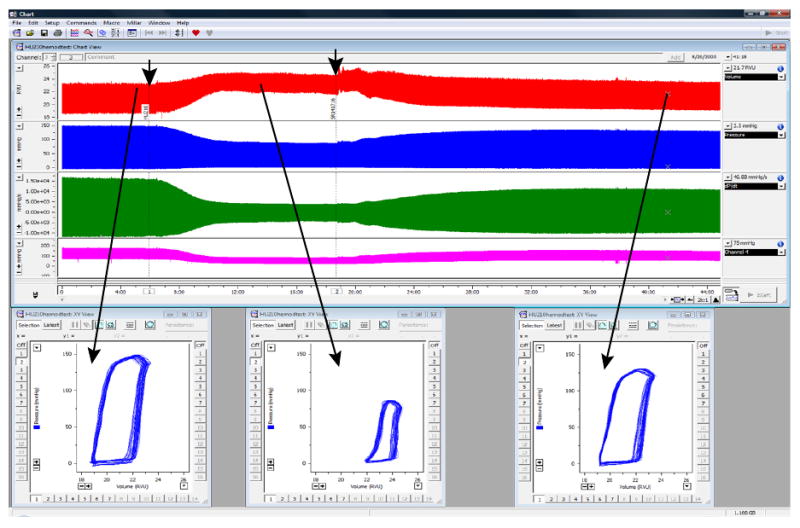
Characteristic changes in rat LV volume (red trace) and pressure (blue trace), +dP/dt and -dP/dt derived from LV pressure signal (green trace), and arterial pressure (purple trace) before (at baseline) or after an administration of a drug with known cardiodepressive properties (a cannabinoid type 1 (CB1) receptor agonist HU210), followed by the recovery after the administration of the CB1 antagonist SR141716 (drug administrations are indicated by arrows). Lower panels show characteristic PV loops at baseline and following the drug administrations. Note that even without any calibrations, the volume traces and PV relationships are very informative. (Used with permission (28))