
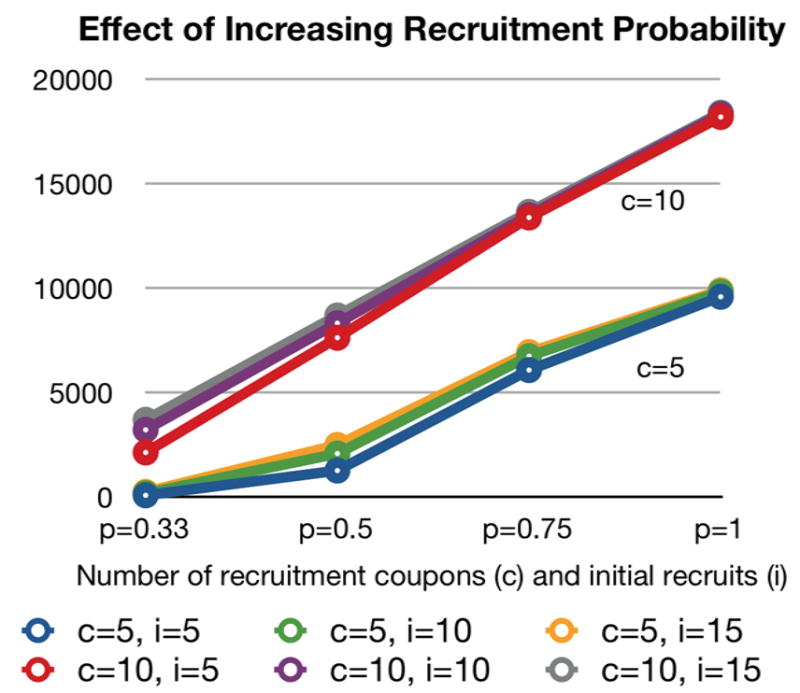
Figure 4. Average number of nodes reached with 100 times MC simulation as probability of recruitment is increased.
Key:
i = initial number of randomly-selected starting individuals from within the observed network
c = Number of recruitment coupons given (i.e. the maximum number of peers that a participant can subsequently recruit for the simulation)
p = Probability that a peer will participate when asked (i.e. the recruitment incentive’s effectiveness)