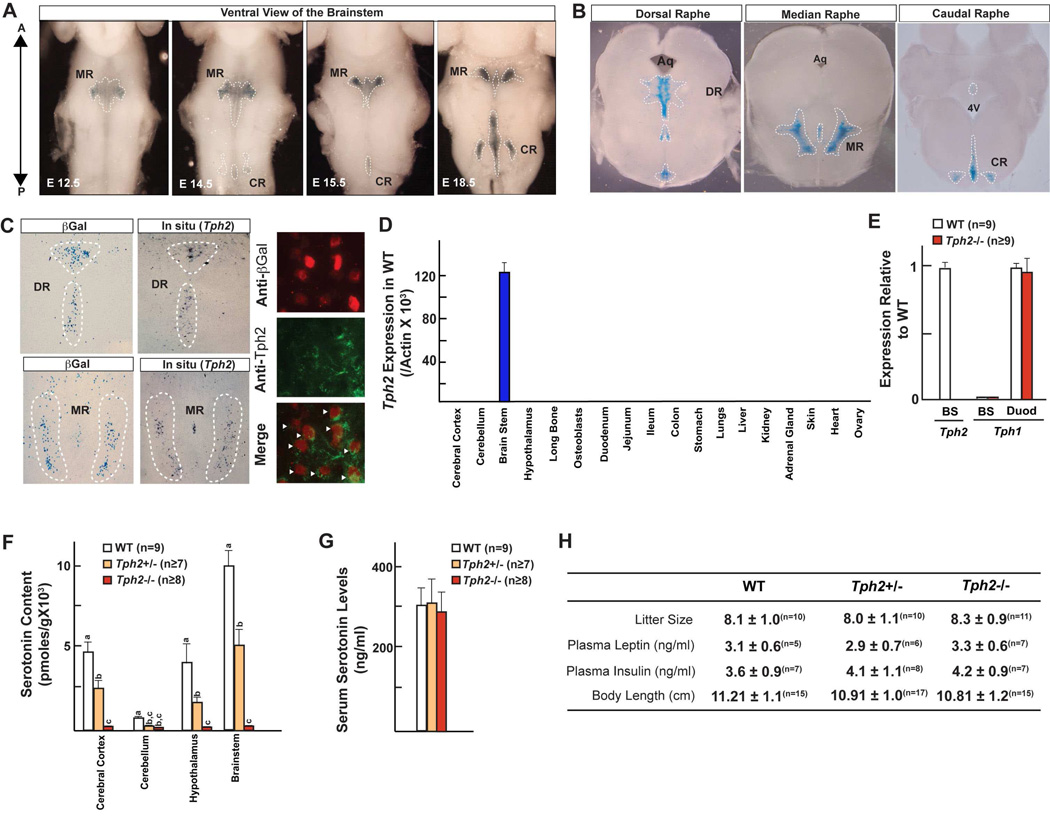
Figure 1. Generation of Tph2−/− mice.
(A) β-Galactosidase staining in the mouse brain during embryonic (E12.5–18.5) development. A: Anterior; P: Posterior.
(B) Localization of Tph2-expressing neurons in the Dorsal (DR; from Bregma −4.04 to −5.49), Median (MR; from Bregma −4.04 to −4.48) and Caudal raphe (CR; from Bregma −4.84 to −7.48) in coronal sections of a mouse brain.
(C) Tph2 expression by in situ hybridization, β-galactosidase staining and co-immunolocalization in Tph2LacZ/+ mice. Arrowheads indicate Tph2/ β-Gal double positive cells.
(D) Real-time PCR (qPCR) analysis of Tph2 expression in tissues of WT mice.
(E) qPCR analysis of Tph2 expression in brainstem (BS) and duodenum (Duod) of WT and Tph2−/− mice.
(F) HPLC analysis of serotonin levels in different regions of brain in WT, Tph2+/− and Tph2−/− mice.
(G) Serum serotonin levels in WT, Tph2+/− and Tph2−/− mice.
(H) Mean litter size, serum biochemistry and body length in WT, Tph2+/− and Tph2−/− mice (n is indicated in superscript above each value).
All panels (except F) * P < 0.05; ** P < 0.01 (Student’s t test). Error bars, SEM. Panel F (One way ANOVA, Newman-Keuls test); Different letters on 2 or more bars indicate significant differences between the respective groups (P < 0.05).

