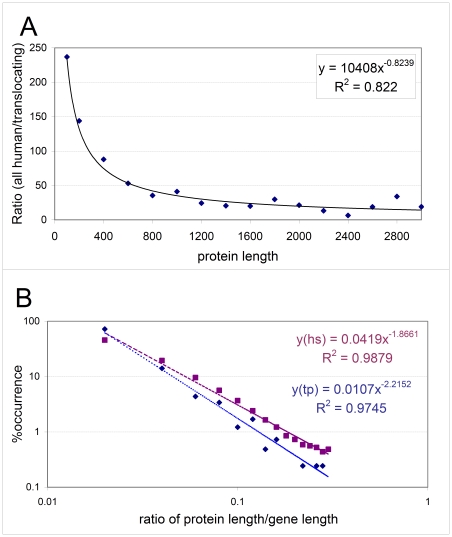
Figure 1. Length of proteins and genes involved in translocation.
(A) Ratio of all human and translocating proteins as a function of protein length, shown by increments of 100 amino acids. The data were fitted with a power function. (B) The percentage distribution of the ratio of protein and gene length for translocating partner proteins (cyan) and all human proteins (magenta). Both functions show a linear tendency when represented on a logarithmic scale (as shown here), which is characteristic of the power law function. The explicit trendline is also shown for both sets of proteins.

