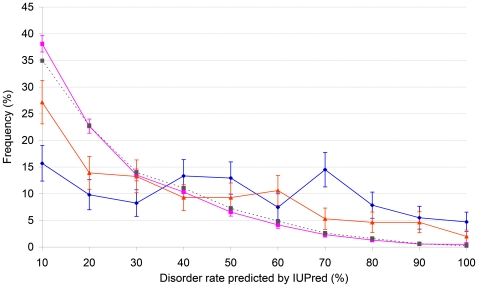
Figure 2. Structural disorder in proteins involved in translocation.
Intrinsic disorder percentage distribution of translocating proteins. The percent intrinsic disorder of proteins involved in chromosomal translocation with (255, blue diamonds) and without (151, orange triangles) a known breakpoint and all human proteins in Swissprot (18,609, magenta squares), is shown. Bin size is 10%. Each of the 406 translocating proteins represents a different gene, the longest known protein isoform was chosen for each. Gray dotted line shows the disorder distribution of 500 randomly selected sets of 255 human Swissprot proteins with length that match that of the 255 translocating proteins with breakpoints.

