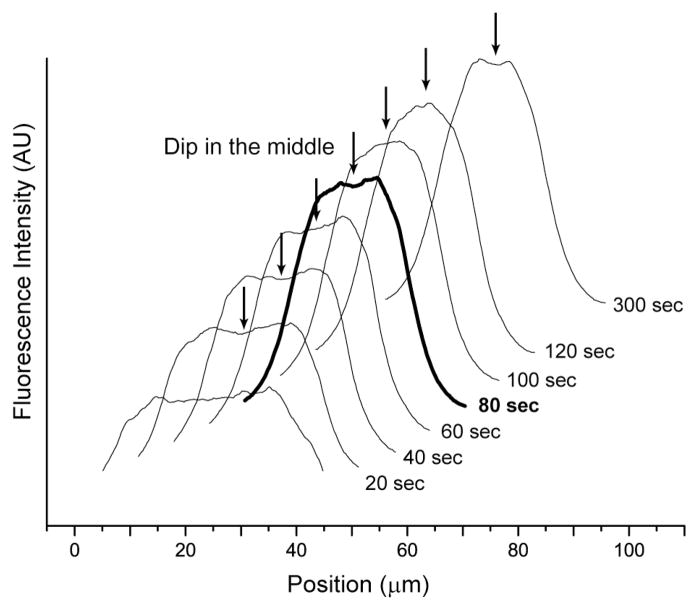
Fig. 5. Fluorescence intensity profiles of progressive migration (focusing) of T2 DNA migration in a microchannel.
The effective shear rate is 78.6 s−1 with an oscillation frequency of 0.25 Hz in 40 μm × 40 μm microchannels. Images (not shown) grabbed at the microchannel centerline for this analysis used a 100× objective. The profiles (see Experimental for details; offset for clarity) show the accumulation of molecules near the channel centerline; however, at 80 sec (bold line) a distinct dip forms at the centerline caused by DNA migration away from channel walls. The dip repeatedly vanishes and reappears even after a well-formed concentration profile is apparent.

