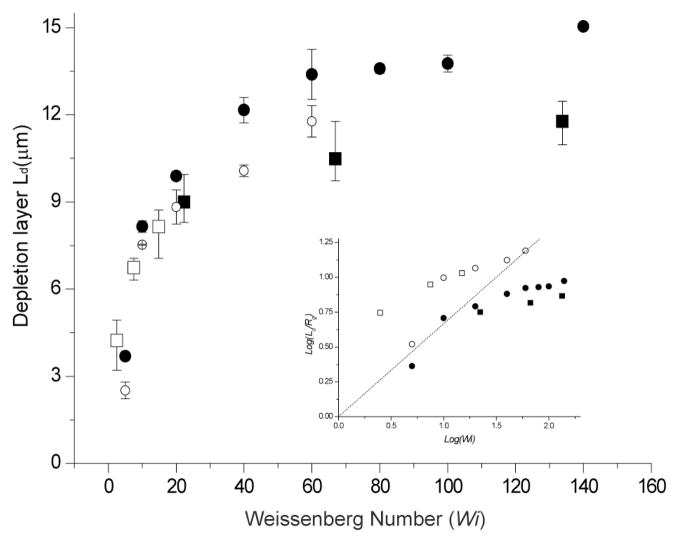
Fig. 6.
Depletion layer dependence on Weissenberg number with comparison to simulation. Experimental data used three effective shear rates: 26.2 s−1, 78.6 s−1, and 157.2 s−1for T2 DNA (164 kb; Rg=1.6 μm;■)34 and λ DNA (48.5 kb; Rg=0.76 μm;□)5 in 40 μm × 40 μm × 8 mm channels. Combining two DNA sizes and three shear rates produces six data points on the plot: The Weissenberg numbers for T2 DNA ranges from 22–133 (τ = 0.85 sec), while λ DNA ranges from 2.5–15 (τ = 0.095 sec). Simulation (T2 DNA:●, λ DNA: ○) results consider a single coarse-grained polymer chain model of beads and springs using Brownian dynamics. A depletion layer thickness (Ld) is calculated from the full width, half-maximal dimensions of a fluorescence intensity profile. Error bars represent the maximum and minimal values on the means from 3–4 separate experiments and SD on the means for 60 simulation runs. Fluorescence intensity profiles were acquired across a channel (10 μm wide) after a consistent concentration profile was achieved (200–320 sec). Inset shows a log-log plot of experimental and simulation results, which are compared against the scaling relationship (Eq. 1; dotted line): Log(Ld/Rg)= (2/3)Log(Wi).

