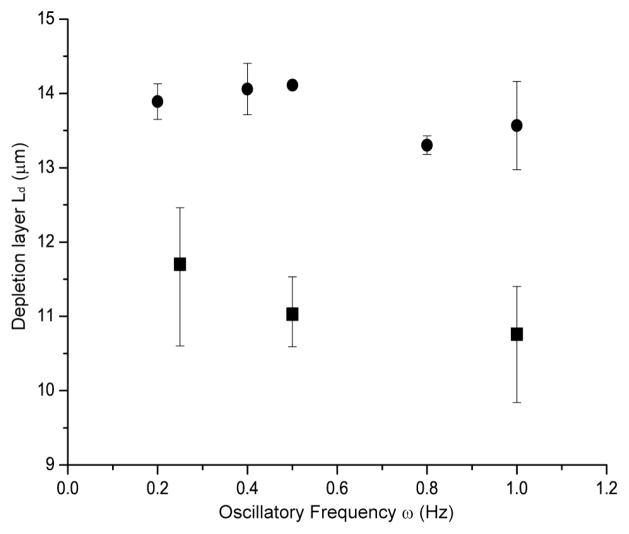
Fig. 7. Depletion layer thickness vs. oscillatory frequency.
Filled squares (■) represent data points obtained at 0.25 Hz, 0.5 Hz, and 1 Hz respectively with the shear rate of 157 s−1 (Wi=134; T2 DNA). Filled circles (●) represent computer simulation results by treating a single DNA molecule with Brownian dynamics without considering the delayed response of PDMS devices. Error bars represent the maximum and minimal values on the means from 3–4 separate experiments and SD on the means for 60 simulation runs. The depletion layer thickness (Ld) is the half-maximal width of fluorescence intensity profile. Higher frequency reduces depletion layers because shear strain experienced by DNA under oscillatory flow decreases as frequency increase. Also, the elastic property of PDMS device and plastic tubing reduces net shear strain. A quantitative measure of the depletion layer thickness (Ld) is calculated as the same method used in Fig. 6.

