
Fig. 5.
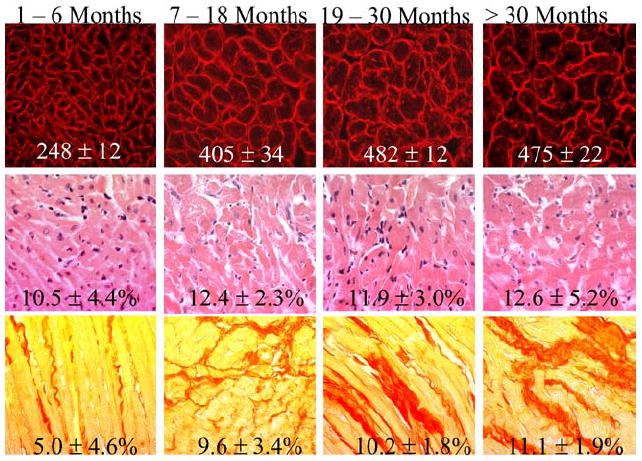
Representative examples of histological phenotypes at four age groups in the cross-sectional study. The upper panels show immunofluorescent thin myocardial sections stained with anti-laminin antibody defining myocyte cross sectional area. Mean values and SD of myocyte cross sectional area of over 5,000 myocytes per each age group is depicted at the bottom of each figure. The middle panels show H&E stained myocardial sections showing myocyte disarray. Percent of myocardium showing myocyte disarray (mean values and SD) was calculated in 4,000 to 6,000 high magnification (x400) fields per each age group and is depicted. The lower panels show examples of picrosirius red stained myocardial sections used to calculate percent of myocardium stained positive for collagen. Mean values and SD, calculated in 10,000 to 15,000 high magnification (x400) fields per each age group, are depicted.