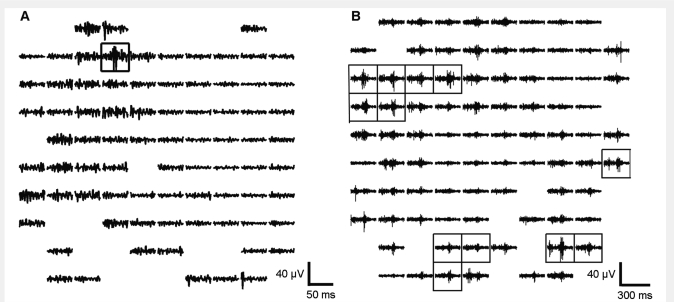
Figure 2.
Spatial pattern of high frequency activity during two HFOEs. The MEA is represented according to its physical layout as a 10 × 10 grid, with each channel corresponding to one square. Within each square, 100–500 Hz bandpass filtered signal is shown. Channels excluded because of data quality and the empty corner positions are indicated by blank squares. Solid black boxes mark channels at which HFOs were detected. (A) HFOE with a single HFO detection from Patient 1. The fast ripple shown in the boxed channel is not seen in neighbouring channels, located at orthogonal distances of 400 μm. (B) Large-scale HFOE associated with a macrodischarge in Patient 4. The time scale reflects the longer duration of the events depicted. The transient increase in 100–500 Hz activity within the time period shown can be seen in the majority of channels, however, not all these met amplitude or duration criteria relative to baseline for HFO detection (see ‘Materials and methods’ section). The figure illustrates how the use of objective detection criteria can mask subthreshold increases in high frequency activity. Differences in amplitude and temporal pattern of the waveforms are apparent, even in adjacent channels.

