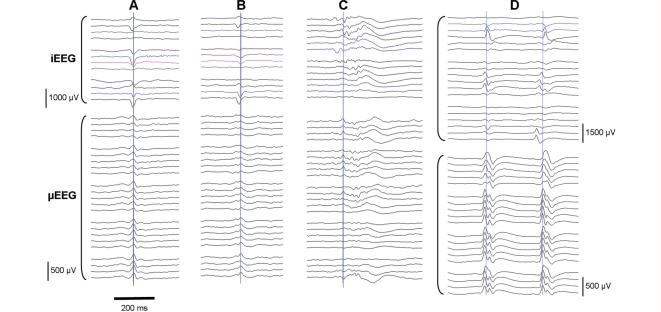
Figure 3.
Macrodischarges and their iEEG correlates. Top grouping: recordings from subdural grid macroelectrodes surrounding the MEA are shown, organized by row and column; blue traces indicate macroelectrodes adjacent to the MEA, and pink traces indicate subdural electrodes directly overlying the MEA. Bottom grouping: selected MEA channels (every other channel in each row and column); channels organized by row. Vertical blue lines are provided for convenience in viewing aligned waveform features. (A and B) Two macrodischarges from Patient 3. The discharge in A appears to align closely with the μEEG waveforms, but the discharge in B is seen to lead in from the bottom iEEG channel. (C) Macrodischarge from Patient 2, with earliest peak appearing in the top row of iEEG channels. (D) Macrodischarges from Patient 4, again showing variations in the relative discharge latencies in the iEEG record. These samples suggest that the location of the MEA relative to the discharge source and propagation pathway is variable.

