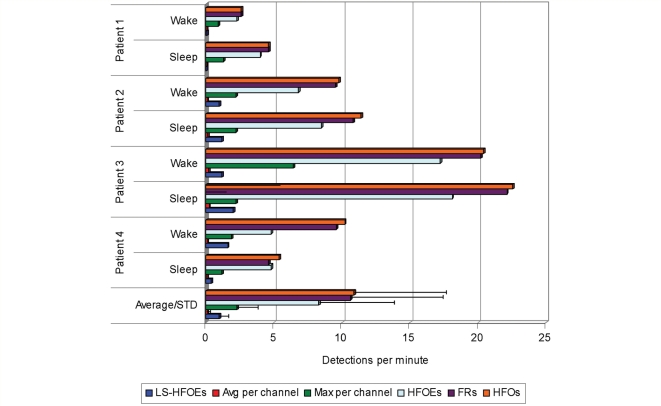
Figure 4.
HFO detection rates per minute in wake and NREM sleep samples. The coloured bars depict rates of HFOs, including all single channel detections; HFOEs, which take simultaneous detections into account; fast ripples; the maximum and average HFOs per channel; and large-scale HFOEs, which comprised a minority of HFO detections overall (12%). The average of each measure (bottom set) with standard deviation indicated by error bars are shown across all wake and sleep samples. Because of the large number of channels, the average rate per channel is very small (range 0.03–0.24, mean 0.12). In comparison to Patient 1, Patients 2–4 showed significantly more frequent HFOs and large-scale HFOEs (Student's t-test, P < 0.05).

