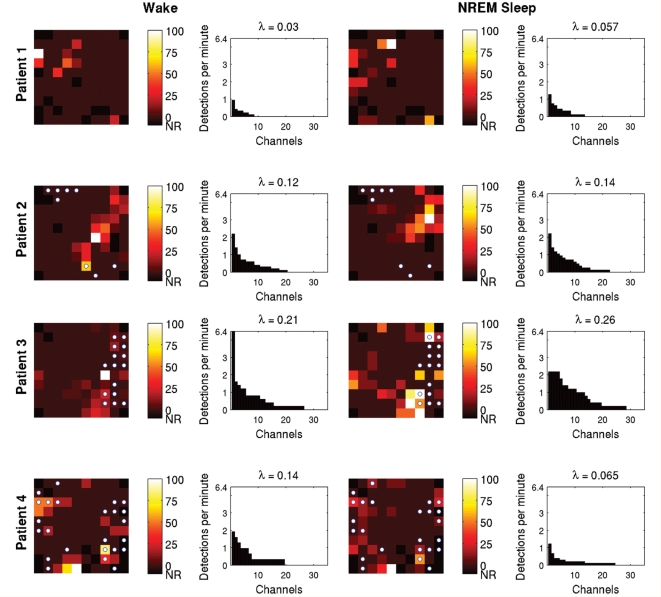
Figure 6.
Spatial distribution of HFOs. HFO rate per channel site, per recording sample is depicted in the topographical maps of the MEA, expressed as a percentage of the maximum rate for that sample. Non-recording channels (NR) are shown in black. Microdischarge sites are indicated by the small white circles. The bar plots were obtained by sorting the channels by HFO rate; channels with no HFO detections are excluded. The concentration of HFO generation in a small number of channels is clearly evident, as is the significantly larger distribution of HFO generating sites in Patients 2–4 compared with Patient 1 (Student's t-test, P < 0.05). Poisson distribution parameters, obtained using maximum likelihood estimation, also were significantly greater in Patients 2–4. Note that the generating regions for HFOs and microdischarges are not co-located, although some overlap is present. Clustering of HFO generating sites near microdischarge sites is particularly evident in Patient 3's data.

