In recent years, a new generation of quantum confined colloidal semiconductor structures has emerged, with more complex shapes than simple quantum dots1, 2. These include nanorods3 and tetrapods4. Beyond shape, it is also now possible to spatially vary the electron and hole potentials within these nanoparticles by varying the composition. Examples of these new structures include seeded dots, rods, and tetrapods, which contain a CdSe core embedded within a CdS shell5–8. These structures may have many uses beyond those envisioned for simple quantum dots, which are frequently employed in luminescent applications9. This paper is concerned with changes in the optoelectronic properties of tetrapods when the arms are bent. We demonstrate that seeded tetrapods can serve as an optical strain gauge, capable of measuring forces on the order of nanonewtons. We anticipate that a nanocrystal strain gauge with optical readout will be useful for applications ranging from sensitive optomechanical devices to biological force investigations.
A tetrapod nanocrystal consists of a central core with four arms branching out at the tetrahedral angle 4. We have previously shown a few ways in which tetrapod arms can be bent. For instance, when a CdTe tetrapod (4 nm wide and 100 nm long arms) is deposited on a substrate through solvent evaporation, the fluid exerts a capillary force which pulls the tetrapod towards the substrate, in some cases permanently deforming the arms10. Salmeron and coworkers used an atomic force microscope to press on the outward-projecting arms of surface-immobilized CdTe tetrapods, and have shown that for forces below 100 nN, the tetrapod flexes elastically11. Motivated by these observations, Wang and coworkers calculated the electronic level structure of a CdSe tetrapod with different degrees of arm bending, induced by nanonewton forces, and predicted a red-shift of the energy gap with increasing strain12.
Seeded tetrapods consisting of a CdSe core with CdS arms are highly luminescent6 and are very symmetric objects. When placed under an anisotropic stress, we expect a reduction in symmetry, which will influence the electronic level structure. To fully quantify such effects, we have examined a series of samples under diverse conditions of stress and strain. Specifically, we have examined the luminescence from seeded dots, rods, and tetrapods placed in a diamond anvil cell (DAC) as a function of applied pressure in a highly hydrostatic medium, which transmits pressure nearly isotropically, as well as a non-hydrostatic medium, which transmits pressure anisotropically. We compare the tetrapods to rods to separate out stress-induced strain effects in a single rod from effects specifically arising in a tetrapod consisting of connected rods. An additional important difference between seeded rods and tetrapods is that the seed in the rod case is of wurtzite (wz) or hexagonal symmetry, while in the tetrapod case it is of zincblende (zb) or cubic symmetry. For this reason, we complete our studies by investigating simple wurtzite seeds under the same conditions of hydrostatic and non-hydrostatic stress. With this set of experiments, we can investigate the effects of deviatoric stresses on the luminescence of seeded tetrapods.
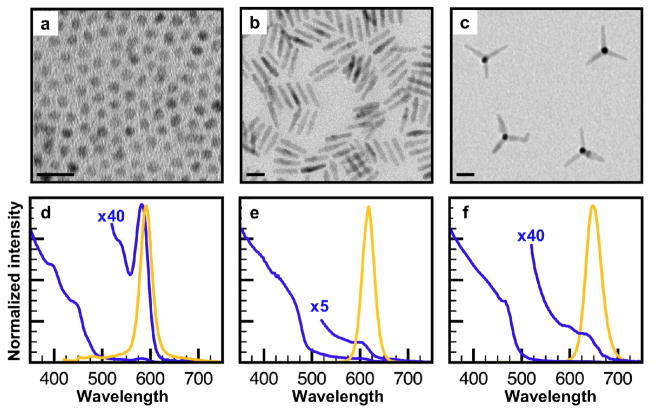
The particles under study were wz-CdSe/wz-CdS core/shell dots, wz-CdSe/wz-CdS core/shell rods, and zb-CdSe/wz-CdS core/shell tetrapods, with 4.4 ± 0.6 nm, 4.0 ± 0.4 nm, and 4.4 ± 0.7 nm cores respectively. Dots were prepared following Li et al.5, and rods and tetrapods were prepared following Talapin et al.6 Structural and optical characterization demonstrate that the particles are of narrow size distribution. Transmission electron microscopy (TEM) images (Fig. 1a–c) reveal dots of 7.0 ± 1.1 nm diameter, rods of 28.4 ± 2.6 nm length × 5.8 ± 1.3 nm width, and tetrapods of 27.8 ± 3.5 nm arm length × 4.8 ± 1.2 nm arm width. Absorbance and fluorescence spectra (Fig. 1d–f) show highly luminescent particles with broad absorption in the region below 500 nm, characteristic for CdS-containing particles, and a narrow photoluminescence (PL) peak of ~30 nm full-width at half-maximum, indicative of a monodisperse sample.
Figure 1.
Transmission electron microscopy (TEM) images and optical properties of CdSe/CdS core/shell nanocrystals with different geometries. TEM images for CdSe/CdS core/shell a) dots (wz-CdSe core/wz-CdS shell), b) rods (wz-CdSe core/wz-CdS rod shell), c) tetrapods (zb-CdSe core/wz-CdS arms). Corresponding ensemble absorption (blue) and fluorescence (orange) spectra for CdSe/CdS d) dots, e) rods, f) tetrapods. The blue x40 and x5 traces are provided for clear visualization of the exciton absorption peak. All scale bars 20 nm.
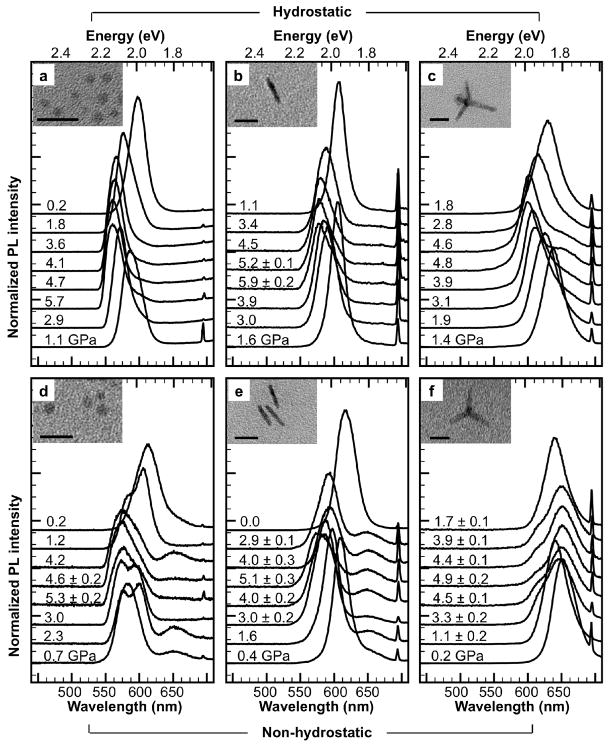
The samples were dispersed in a hydrostatic (1:1 v/v pentane:isopentane) or non-hydrostatic (toluene) pressure medium, and loaded into the DAC, with an initial pressure of 0.5–1 GPa. Toluene freezes at 1.7 GPa and shows high viscosity behavior above ambient pressures, indicative of a highly anisotropic, non-hydrostatic pressure transmitting medium13. The pressure in the DAC was increased to <6 GPa, and then decreased to ambient pressure. Fluorescence traces obtained during the experiment (Fig. 2) demonstrate highly contrasting behavior between hydrostatic and non-hydrostatic pressure conditions, and among particle geometries. The most obvious trend under hydrostatic pressure is a pressure-induced blue-shift of the PL peak. A slight asymmetric broadening of the peak at longer wavelengths is observed at higher pressures. The behavior under non-hydrostatic pressure is markedly different. For dots, the PL peak splits into a doublet at pressures above 0.7 GPa. For dots and rods, a shallower peak also typically arises at ~650 nm. The PL peak in tetrapods instead slightly red-shifts with increasing pressure, with the appearance of a small blue shoulder. The fluorescence behavior is reversible, with no apparent hysteresis, although the PL peaks are somewhat wider at the end of the experiment. The particles remained intact throughout the experiment as demonstrated by sample recovery post-compression (Fig. 2 insets); we found that above 6 GPa, recovered nanoparticles were broken due to the high non-hydrostatic pressure environment within the cell. We did not observe the abrupt PL intensity decrease or peak broadening associated with a phase transition to rock salt14; due to the mechanically stiffer CdS shell on the surface, these particles likely undergo this phase transition at higher pressures 15. The sharp spectral peak around 700 nm is from fluorescence of the ruby grains used as a pressure gauge within the DAC16.
Figure 2.
Fluorescence spectra of CdSe/CdS nanocrystals in a diamond anvil cell (DAC) under hydrostatic and non-hydrostatic pressure. DAC fluorescence traces in hydrostatic 1:1 v/v pentane:isopentane medium for CdSe/CdS a) dots, b) rods, c) tetrapods; and in non-hydrostatic toluene medium for CdSe/CdS d) dots, e) rods, f) tetrapods. Subsequent spectra at different pressure points are shown in stacked offsets. Pressure ± pressure gradient (only if gradient ≥ 0.1) in GPa is labeled on the corresponding trace. Insets show TEM images of post-DAC recovered particles. All scale bars 20 nm. Fluorescence spike ~694 nm is due to fluorescence from ruby grains, used to determine pressure inside the DAC.
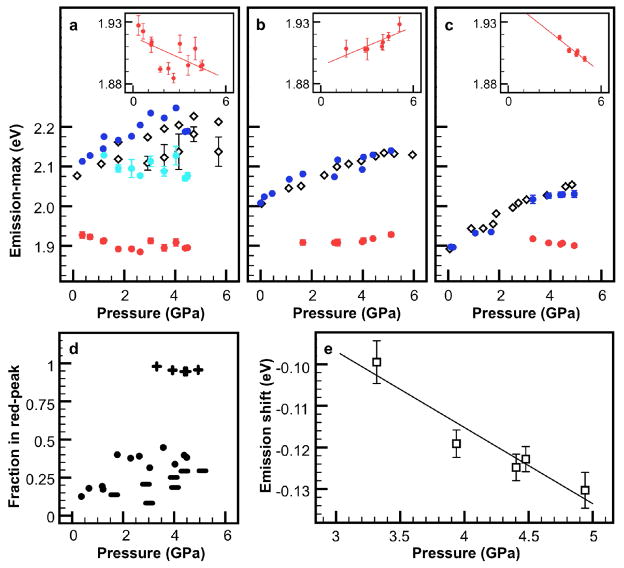
To quantitatively evaluate the PL shifts of the particles, we fit the experimental data to a sum of Gaussian curves (see analysis methods in Supporting Information). PL peak energies as a function of pressure are shown in Fig. 3a-c, and the percentage of particles in the red-most peak, calculated from the area under the fitted peak, shown in Fig. 3d. There are four notable observations from this analysis. First, under non-hydrostatic pressure for all three particle morphologies, two PL peaks are observed: a blue-peak, whose energy as a function of pressure matches with that of the peak under hydrostatic pressure, and a red-peak, which does not exist under hydrostatic pressure conditions. The two peaks are likely due to fluorescence from two populations within the cell, rather than two allowed transitions within individual particles, since the energy difference between the two peaks is much greater than the thermal energy available. However, future single particle fluorescence experiments are required to confirm this assessment. That the blue-peak and hydrostatic peak energies match so well suggests that the particles emitting at the blue-peak experience a near-hydrostatic environment within the DAC, while those emitting at the red-peak are affected by the non-hydrostaticity. Second, under non-hydrostatic pressure for dots, the blue-peak further splits into at least two peaks, but possibly more, as evidenced by the greater spread in peak position (Fig. 3a). The hydrostatic pressure peak for dots, with a broader red side, is also fit to two peaks for comparison. This blue-peak splitting phenomenon is not observed for rods or tetrapods. Third, for dots and rods under non-hydrostatic pressure, the energy of the red-peak changes somewhat (−5.6 and 5.2 meV/GPa respectively), while for tetrapods the red-peak emission red-shifts at nearly two times this rate (−9.9 meV/GPa) (Fig. 3a-c insets). Fourth, tetrapods are clearly the most affected by the non-hydrostatic pressure, with more than 95% of the population in this red-peak state (Fig. 3d). This agrees intuitively considering the shape and larger size of tetrapods compared with dots and rods. This also demonstrates that tetrapods are the most suitable particle geometry for strain sensing as they are most likely to be strained. Under hydrostatic pressure, the particles are isotropically compressed, while under non-hydrostatic pressure, the particles additionally experience a net deviatoric stress which includes uniaxial and shear stresses. The difference between the two informs the net strain due only to non-hydrostatic stress. To investigate the optical effects of only non-hydrostatic stress on the tetrapods, which leads to arm bending, the energy difference between the non-hydrostatic peak and hydrostatic shoulder (Fig. 2f) is plotted (Fig. 3e). We observe a clear red-shift with increasing stress. Although the strain state inside a DAC at nanometer size scales cannot be readily quantified, from the pressure gradient inside the cell and the particle size we calculate a force per particle on the order of nanonewtons. This is of the same magnitude as the forces previously observed to bend tetrapod arms11, 12
Figure 3.
Deviatoric stresses induce new radiative transitions in semiconductor nanocrystals. Fluorescence peak positions in CdSe/CdS a) dots, b) rods, c) tetrapods. Unfilled symbols denote the peak positions in 1:1 pentane:isopentane; filled symbols denote the peak positions in toluene. Under non-hydrostatic pressure, three radiative transitions are observed in dots and two radiative transitions are observed in rods and tetrapods. Insets in a)–c) provide a magnification of the emission points at the transition ~1.9 eV, with x-axis 0–6 GPa and y-axis 1.879–1.937 eV; linear fit provides a guide to the eye. d) Percentage of particles emitting in the transition ~1.9 eV under compression in toluene. Less than 50% of dots (circles) and rods (rod-shapes) emit at this transition, while nearly 100% of tetrapods (crosses) do. e) A difference plot of the fluorescence peak maxima for CdSe/CdS tetrapods compressed in hydrostatic and non-hydrostatic media provides a measure of the net deviatoric stress effect—which induces tetrapod arm bending—on tetrapod emission. A fluorescence peak red-shift due to non-hydrostatic stress on the order of nanonewtons per particle is observed (see discussion). The linear fit shown provides a guide to the eye. Error bars show the standard error of peak position from the fit.
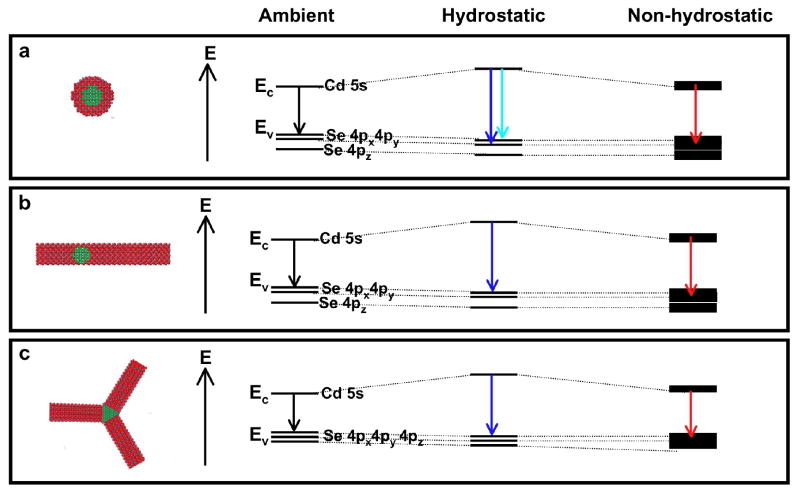
A model to explain the observed behavior is shown in Fig. 4. In CdSe/CdS nanocrystals, the fluorescence recombination occurs in the CdSe core, with the electron relatively more delocalized throughout the nanocrystal while the hole is confined to the core17–22. The conduction band is comprised mainly of Cd 5s orbitals. For dots and rods, with a wz-CdSe core, the valence band is comprised mainly of Se 4px and 4py orbitals; the valence band of tetrapods, which have a zb-CdSe core, is comprised of Se 4px, 4py, and 4pz orbitals. Under hydrostatic pressure conditions the crystal bonds are compressed, and the greater wavefunction overlap leads to a blue-shift of the energy gap, mainly due to an increase in the conduction band energy23, 24. Small deviatoric stresses lead to the observed fluorescence peak asymmetry particularly seen in dots. This effect is more obvious under non-hydrostatic pressure, where the blue-peak for dots splits into at least two luminescent states due to stress. This effect has been previously observed for bulk CdSe stressed in different directions25. For rods, blue-peak splitting is not as prominent due to the elongated CdS shell on the CdSe (100) faces; the mechanically stiffer CdS26 hinders compression along the CdSe c-axis. Therefore, fewer luminescent strain states are possible. Intermediate behavior for rods with the same size CdSe core but shorter CdS rod shells is observed (Supporting Information, Fig. S1). Under higher non-hydrostatic pressure conditions, experimentally achieved by particle dispersion in toluene, some bonds in the crystals are pulled apart by torque, leading to a red-shift of the energy gap. Because the particles are randomly oriented with respect to the net uniaxial strain, the observed ensemble energy levels are broadened.
Figure 4.
Schematic of proposed photoluminescence transitions for CdSe/CdS nanocrystals under ambient, hydrostatic, and non-hydrostatic pressure. Crystal structures and band diagram schematics for CdSe/CdS a) dots (wz-CdSe core), b) rods (wz-CdSe core), and c) tetrapods (zb-CdSe core) at ambient pressure (left), under hydrostatic pressure (center), and under non-hydrostatic pressure (right). Under hydrostatic pressure, the bonds between all atoms are compressed, resulting in a blue-shift of the energy gap. Dots are sensitive to slight deviations from hydrostaticity, leading to a few observed optical transitions under hydrostatic pressure depending on the orientation of the dot with respect to the small deviatoric stresses. Under non-hydrostatic pressure, deviatoric stresses induce stretching in some bonds, resulting in an energy gap red-shift. Because the particles may be oriented in any direction within the DAC, deviatoric stress results in different crystallographic strain of the particles, broadening the ensemble electronic band structure.
The distinction between tetrapods versus dot and rod particles is that the unique geometry of tetrapods makes them more physically sensitive to stress-induced effects. Once the medium has frozen (or become quite viscous) around the tetrapods, further application of anisotropic stress applies bending moments to each of the tetrapod arms, with each arm’s bending moment dependent on its orientation relative to the principal stress axes. Thus the arms of the tetrapod act essentially as lever arms, subjecting the zb-CdSe core to large shear stresses so that some bonds are stretched and others compressed relative to the hydrostatic configuration. The data suggest that the net result of arm bending is a red-shifting of the energy gap. Consequently, forces which bend tetrapod arms may be optically detected.
While we considered other mechanisms for previously observed strain- and shape-dependent optical phenomena to explain our findings, they are ruled out given our experimental design. First, it has been hypothesized that the blue-PL peak split in CdSe quantum-dot solids arising at non-hydrostatic pressure conditions is due to an energy transfer mechanism between particles27. This cannot be the central mechanism in our experiment, since the nanoparticle sample is dilute. Second, the appearance of the red-peak under non-hydrostatic pressure conditions is not due to a type I-type II heterostructure transition28, since this peak is also observed in our bare CdSe dot pressure studies (Supporting Information, Fig. S2). Finally, an aspect ratio-induced crossover between the bands formed by the Se 4px 4py and the Se 4pz orbitals29 does not cause the red-peak observed in the present study; the particle compression is too slight to increase the aspect ratio. However, under non-hydrostatic conditions the Se 4pz band may be at higher energy than the 4px and 4py bands for dots and tetrapods due to greater compression in the z-direction23.
In summary, our experiments demonstrate that the optical properties of highly luminescent CdSe/CdS nanocrystals are altered in response to external stresses. These particles, with the same long-lasting and narrow-emission advantages of shell-encapsulated quantum dots9, provide nanonewton-sensitive nanocrystal analog of the mechanoresponsive polymeric materials recently described30. Core/shell dots, because of their small size, isotropic shape, and lack of steric hindrance, may be employed to quantify non-hydrostaticity, for example within a DAC. Tetrapods, due to their unique geometry, are particularly suited for use as an optical strain gauge. Further development of tetrapods in this capacity requires precise calibration of the fluorescence emission shift with force by alternate methods, since the strain state inside a DAC at nanometer size scales cannot be readily determined. Synthetic tunability of size and shape may allow tetrapods sensitive to forces over a range of magnitudes. An optical strain gauge, sensing nanonewton forces, will be useful for optomechanical devices and investigations of biomechanic processes.
Supplementary Material
Acknowledgments
The high-pressure fluorescence experiments were performed at supporting labs of beamline 12.2.2 of the Advanced Light Source (ALS) at Lawrence Berkeley National Laboratory. The authors would like to thank James H. Nelson for CdSe/CdS rod samples, Simon Clark for instrument support, Katie Lutker for gasket preparation, and Jonathan Chou, Young-wook Jun, and Tze-Leung Lai for helpful discussions. The paper is dedicated to David Godfrey. This work was supported in part by the NIH Roadmap Initiative in Nanomedicine through a Nanomedicine Development Centre award (PN2EY016546) and also by grants from the Director, Office of Science, Office of Basic Energy Sciences, of the United States Department of Energy under Contract DE-AC02-05CH11231.
Footnotes
Supporting Information Available. Experimental methods for nanocrystal characterization, diamond anvil cell studies, and spectral analysis; emission peak maxima for CdSe/CdS rods of different lengths in toluene in a diamond anvil cell (Fig. S1); fluorescence spectra of bare zb-CdSe dots in a diamond anvil cell (Fig. S2).
References
- 1.Alivisatos AP. Science. 1996;271:933–937. [Google Scholar]
- 2.Murray CB, Kagan CR, Bawendi MG. Annu Rev Mater Sci. 2000;30:545–610. [Google Scholar]
- 3.Peng X, Manna L, Yang W, Wickham J, Scher E, Kadavanich A, Alivisatos AP. Nature. 2000;404(6773):59–61. doi: 10.1038/35003535. [DOI] [PubMed] [Google Scholar]
- 4.Manna L, Milliron DJ, Meisel A, Scher EC, Alivisatos AP. Nat Mater. 2003;2(6):382–5. doi: 10.1038/nmat902. [DOI] [PubMed] [Google Scholar]
- 5.Li JJ, Wang YA, Guo W, Keay JC, Mishima TD, Johnson MB, Peng X. J Am Chem Soc. 2003;125(41):12567–75. doi: 10.1021/ja0363563. [DOI] [PubMed] [Google Scholar]
- 6.Talapin DV, Nelson JH, Shevchenko EV, Aloni S, Sadtler B, Alivisatos AP. Nano Lett. 2007;7(10):2951–9. doi: 10.1021/nl072003g. [DOI] [PubMed] [Google Scholar]
- 7.Carbone L, Nobile C, De Giorgi M, Della Sala F, Morello G, Pompa P, Hytch M, Snoeck E, Fiore A, Franchini IR, Nadasan M, Silvestre AF, Chiodo L, Kudera S, Cingolani R, Krahne R, Manna L. Nano Lett. 2007;7(10):2942–2950. doi: 10.1021/nl0717661. [DOI] [PubMed] [Google Scholar]
- 8.Fiore A, Mastria R, Lupo MG, Lanzani G, Giannini C, Carlino E, Morello G, De Giorgi M, Li Y, Cingolani R, Manna L. J Am Chem Soc. 2009;131:2274–2282. doi: 10.1021/ja807874e. [DOI] [PubMed] [Google Scholar]
- 9.Alivisatos P. Nat Biotechnol. 2004;22(1):47–52. doi: 10.1038/nbt927. [DOI] [PubMed] [Google Scholar]
- 10.Cui Y, Bjork MT, Liddle A, Sonnichsen C, Boussert B, Alivisatos AP. Nano Lett. 2004;4(6):1093–1098. [Google Scholar]
- 11.Fang L, Park JY, Cui Y, Alivisatos AP, Schrier J, Lee B, Wang LW, Salmeron M. J Chem Phys. 2007;127:184704–1–184704–6. doi: 10.1063/1.2786993. [DOI] [PubMed] [Google Scholar]
- 12.Schrier J, Lee B, Wang LW. J Nanosci Nanotechnol. 2008;8(4):1994–1998. [PubMed] [Google Scholar]
- 13.Herbst CA, Cook RL, King HE. J Non-Cryst Solids. 1994;172:265–271. [Google Scholar]
- 14.Tolbert SH, Alivisatos AP. J Chem Phys. 1995;102(11):4642–4656. [Google Scholar]
- 15.Schroder J, Persans PD. J Lumin. 1996;70:69–84. [Google Scholar]
- 16.Mao HK, Bell PM, Shaner JW, Steinbert DJ. J Appl Phys. 1978;49(6):3276–3283. [Google Scholar]
- 17.Peng X, Schlamp MC, Kadavanich A, Alivisatos AP. J Am Chem Soc. 1997;119:7019–7029. [Google Scholar]
- 18.Talapin DV, Koeppe R, Götzinger S, Kornowski A, Lupton JM, Rogach AL, Benson O, Feldmann J, Weller H. Nano Lett. 2003;3(12):1677–1681. [Google Scholar]
- 19.Müller J, Lupton JM, Rogach AL, Feldmann J, Talapin DV, Weller H. Phys Rev Lett. 2004;93(16):167402. doi: 10.1103/PhysRevLett.93.167402. [DOI] [PubMed] [Google Scholar]
- 20.Steiner D, Dorfs D, Banin U, Della Sala F, Manna L, Millo O. Nano Lett. 2008;8(9):2954–2958. doi: 10.1021/nl801848x. [DOI] [PubMed] [Google Scholar]
- 21.Müller J, Lupton JM, Lagoudakis PG, Schindler F, Koeppe R, Rogach AL, Feldmann J. Nano Lett. 2005;5(10):2044–2049. doi: 10.1021/nl051596x. [DOI] [PubMed] [Google Scholar]
- 22.Mauser C, Limmer T, Da Como E, Becker K, Rogach AL, Feldmann J, Talapin DV. Phys Rev B. 2008;77(15):153303. [Google Scholar]
- 23.Wei SH, Zunger A. Phys Rev B. 1999;60(8):5404–5411. [Google Scholar]
- 24.Li JB, Wang LW. Appl Phys Lett. 2004;85(14):2929–2931. [Google Scholar]
- 25.Langer DW, Euwema RN, Era K, Koda T. Phys Rev B. 1970;2(10):4005–4022. [Google Scholar]
- 26.Handbook on Physical Properties of Semiconductors. Vol. 3 Springer-Verlag; 2004. [Google Scholar]
- 27.Grant CD, Crowhurst JC, Hamel S, Williamson AJ, Zaitseva N. Small. 2008;4(6):788–94. doi: 10.1002/smll.200701097. [DOI] [PubMed] [Google Scholar]
- 28.Smith AM, Mohs AM, Nie S. Nat Nanotechnol. 2009;4(1):56–63. doi: 10.1038/nnano.2008.360. [DOI] [PMC free article] [PubMed] [Google Scholar]
- 29.Hu J, Li L, Yang W, Manna L, Wang L, Alivisatos AP. Science. 2001;292(5524):2060–3. doi: 10.1126/science.1060810. [DOI] [PubMed] [Google Scholar]
- 30.Davis DA, Hamilton A, Yang J, Cremar LD, Van Gough D, Potisek SL, Ong MT, Braun PV, Martinez TJ, White SR, Moore JS, Sottos NR. Nature. 2009;459:68–72. doi: 10.1038/nature07970. [DOI] [PubMed] [Google Scholar]
Associated Data
This section collects any data citations, data availability statements, or supplementary materials included in this article.


