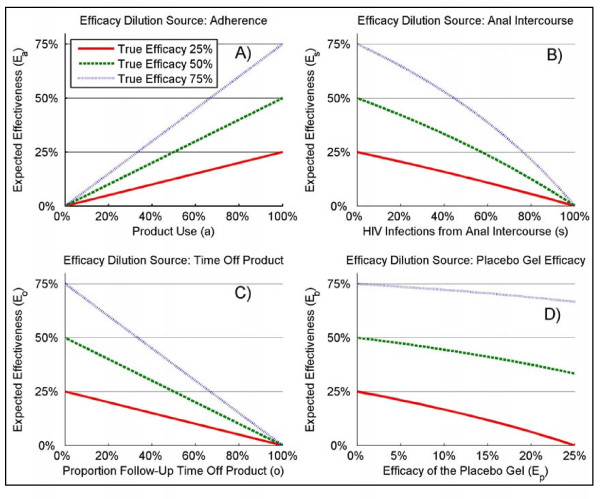
Figure 1.
Expected effectiveness for different source of dilution. For different level of true efficacy of a candidate microbicide; ET = 25%, 50%, and 75%; Panel A shows the results for the dilution due to adherence (Ea), Panel B shows the results for the dilution due to HIV infections from anal intercourse (Es), Panel C shows the results for the dilution from time off-product due to pregnancy (Eo), and Panel D shows the results for the dilution due to the efficacy of the placebo gel (Eb).

