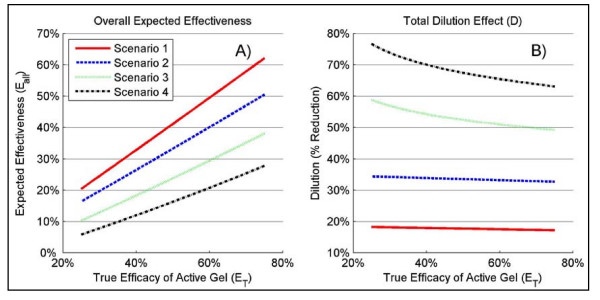
Figure 2.
Overall expected effectiveness and total dilution effect. For the four different scenarios described in Table S3 (see Table S3 in additional file 3) and as a function of the true efficacy of a candidate microbicide (ET), Panel A shows the results for the overall expected effectiveness (Eall) and Panel B shows the results for the total dilution effect (D).

