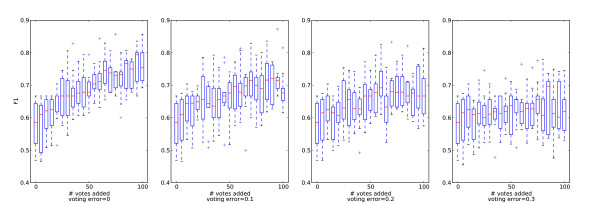
Figure 3.
Box plots showing the effect of adding simulated user votes. Each subplot shows the effect of adding 100 simulated user votes with controlled error rates (0-0.3) to a training set with 100 entries for the binding category. The votes are added in increments of 5 votes, the training set for the classifier producing the first box plot has 0 votes added (only the resampled 100 base votes), the next one has 5 votes added, etc. The last box plot shows the performance after adding 100 simulated user votes to the base votes.

