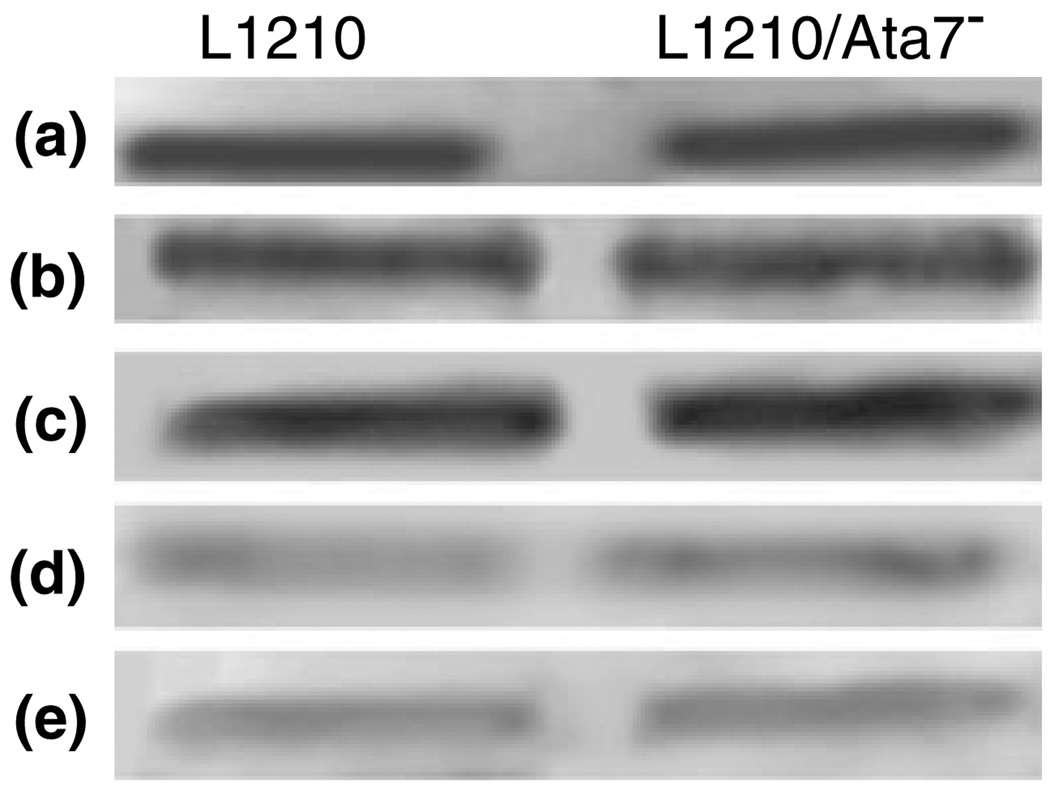
Figure 6.
Western blot analyses of Bcl-2 expressions in L1210 and L1210/Atg7− cells. Cultures were sensitized with MC or CPO and irradiated at low vs high PDT doses (see Table 1 for details). Cultures were harvested immediately after irradiation for analyses of Bcl-2. a = controls, b = MC low dose, c = CPO low dose, d = MC high dose, e = CPO high dose.

