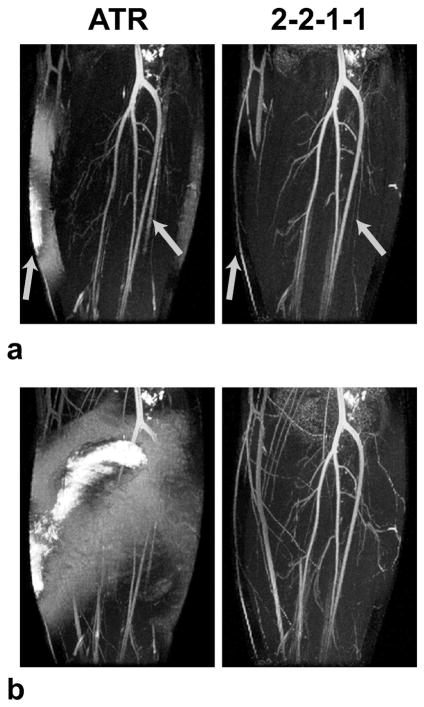
Figure 11.
3 T results. The thin-slab (a) and whole-volume (b) MIPs of ATR and multiple-TR acquisitions are shown. The broad multiple-TR stop-band successfully reduces the fat signal in regions where ATR-SSFP fails. Poor fat suppression deteriorates the vessel depiction with ATR-SSFP as seen in a. Furthermore, improperly suppressed bone-marrow signal in the fibula with ATR-SSFP confounds the thin-slab MIPs. These regions are shown with arrows in a. The ATR-SSFP image in b has very bright fat signal in the peripheral regions. This indicates that the stop-band width of ATR-SSFP becomes insufficient with the increased field inhomogeneity at 3 T. In contrast, the multiple-TR image has adequate suppression over the whole volume.

