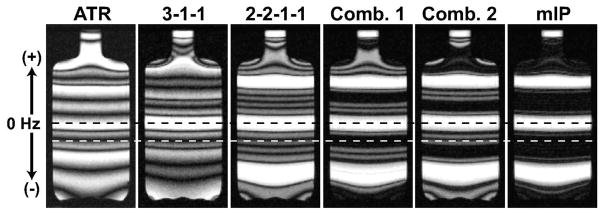
Figure 9.
Phantom images were acquired to demonstrate the created magnetization profiles, where the precession frequency was vertically varied with a linear field gradient in that direction. The ATR-SSFP, 3-1-1, and 2-2-1-1 images are shown in order from left to right. Water and fat resonances at 1.5 T are marked with the dashed black and white lines respectively. The multiple-TR sequences have significantly more uniform pass-bands than ATR. Meanwhile, the 2-2-1-1 sequence has the broadest stop-band and the highest level of suppression. The suppression in separate segments of the stop-band can be independently improved with linear combinations as shown in Comb. 1 and 2. Finally, a mIP of these combinations yields enhanced suppression over the whole stop-band.

