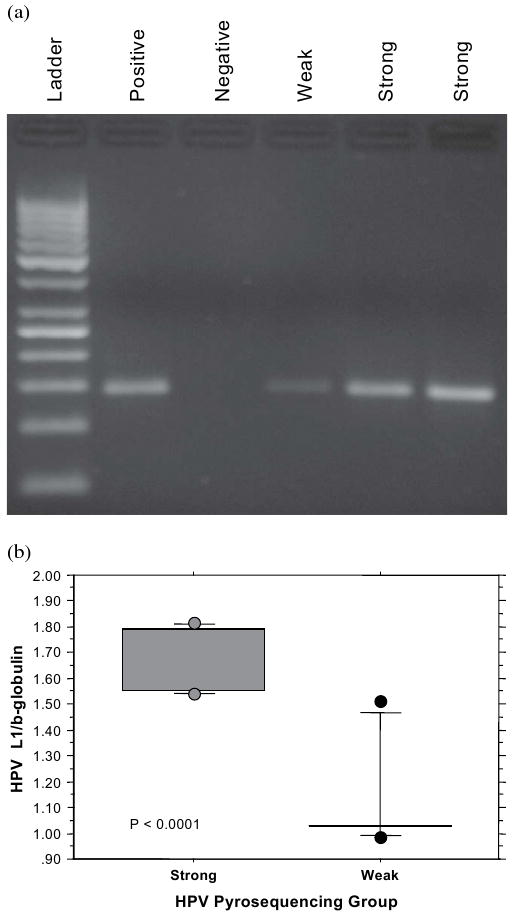
Fig. 1.

(a) Representative agarose gel stained with ethidium bromide for fragment size determination (at expected size of ∼185 base pairs) and polymerase chain reaction (PCR) amplification yield for the L1 region of human papillomavirus (HPV) genome. The gel shows PCR results for samples with strong, weak, and negative signal intensity based on measured amplicon concentration (undectable level as negative, <100 ng/10 μL as weak and ≥100 ng/10 μL strong). (b) Box and whisker plot, showing the quantitative real-time PCR results for HPV L1 signals normalized against β-globulin in 12 randomly selected samples: 6 from the HPV pyrosequencing strong group and 6 from the HPV pyrosequencing weak group.
