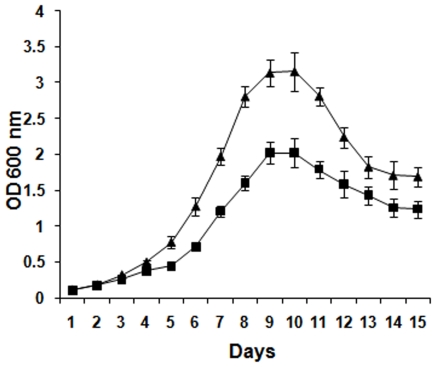
Figure 5. Effect of Hcl1 on the growth of M. tuberculosis.
Three individual colonies each from mycobacteria harbouring either hcl1pVV16 (Mtb/Hcl1) or pVV16 (Mtb/pVV16) were picked for growth curve analysis. Optical density of each culture was measured at 600 nm. Mean±s.d values are plotted against time (in Days). A similar growth curve pattern was observed each time the experiment was repeated. Triangular data points represent OD600 values of Mtb/pVV16 samples; Squares represent OD600 values of Mtb/Hcl1 samples.

