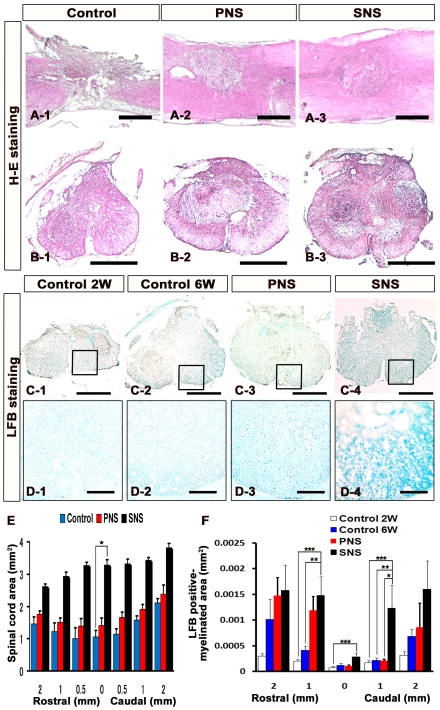
Figure 2. Transplanted SNS prevented atrophic change and demyelination after SCI.
(A)(B) Representative H–E staining images of the sagittally sectioned (A1–3) and axially sectioned (B1–3) spinal cord at the lesion epicenter 6 weeks after injury. Scale bar: 500 µm. (C) Representative LFB staining images of the axially sectioned spinal cord 1 mm caudal to the lesion from each animal (2 weeks or 6 weeks after SCI for the vehicle-control group and 6 weeks after SCI for the PNS and SNS groups). Scale bar: 500 µm. (D) Higher magnification images of the boxed areas in C. Scale bar: 100 µm. (E) Quantitative analysis of the spinal cord area measured in H–E-stained axial sections through different regions. The transverse area of the spinal cord at the lesion epicenter was significantly larger in the SNS group compared with the control group. Values are means ± s.e.m. (n = 5). *: P<0.05, Control vs. SNS. (F) Quantitative analysis of the myelinated area by LFB-stained axial sections at different regions. LFB staining revealed greater preservation of myelination in the SNS group, with significant differences observed at the sites 1 mm rostral and 1 mm caudal to the epicenter compared with the control 2 or 6 weeks groups, 1 mm caudal to the epicenter compared with the PNS group, and at the epicenter compared with the control 2-week group. Values are means ± s.e.m. (n = 5). *: P<0.05, PNS vs. SNS. **: P<0.05, Control 6 weeks vs. SNS. ***: P<0.05, Control 2 weeks vs. SNS.

