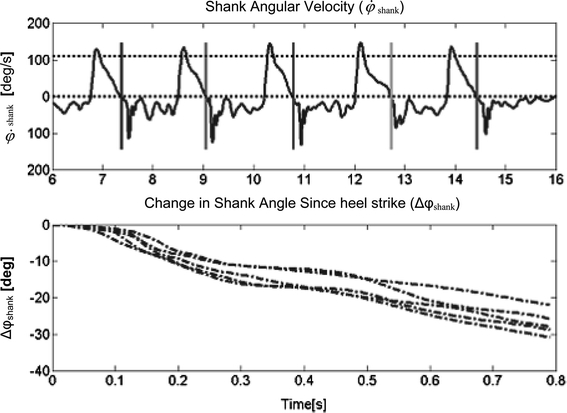
Fig. 4.

Patient Data. a Angular velocity [deg/s] of stroke subject number 5 during gait. Uppermost, horizontal dashed line is T sw, parallel to this, along zero is the zero line. The vertical lines indicate zero crossing. b Integrated angular velocity (change in angle in [deg] vs. time [s]) since negative crossing through zero
