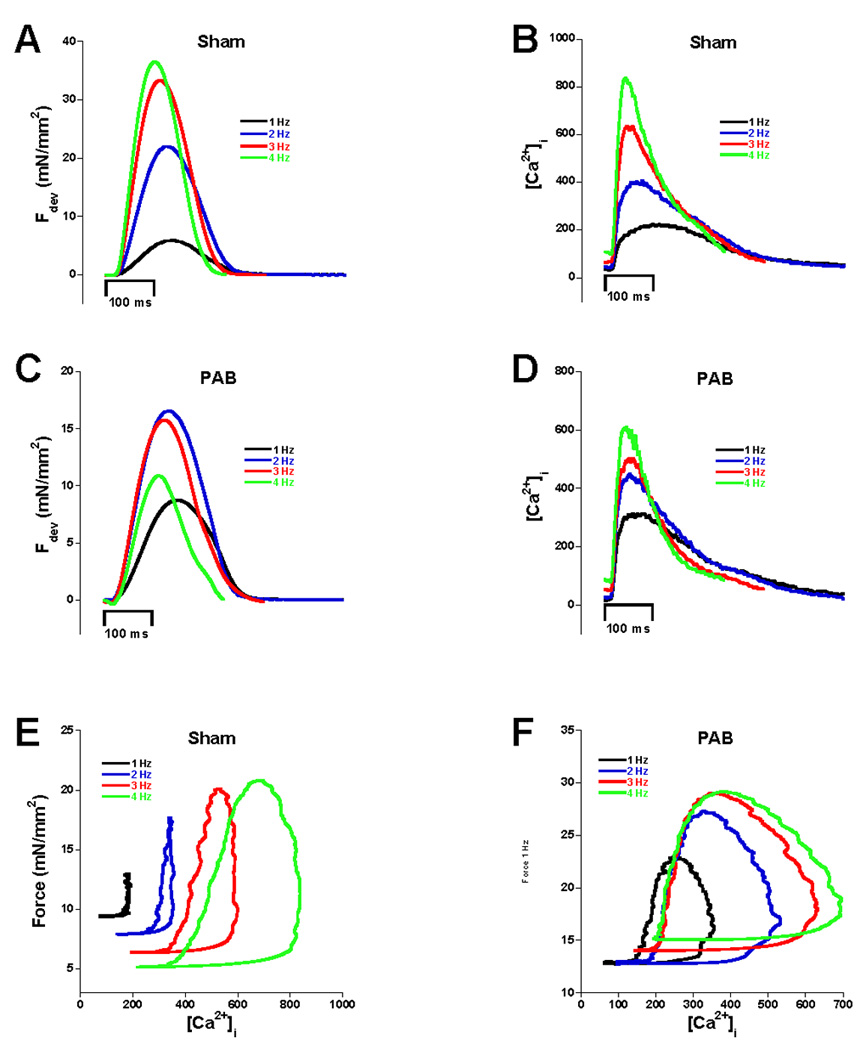
Figure 3.

Examples of force twitches and calcium transients. Panels A and B show force tracings and calcium respectively for sham animals. Positive FFR and calcium frequency relationships were observed. PAB animals displayed blunted FFR (C), and a slightly blunted though still positive calcium frequency relationship (D). Phase planes of the relationship of force and calcium during a twitch are shown for sham (E) and PAB (F). Note that the loops shift downward and to the right in the sham example but upward and only slightly to the right in the PAB example.
